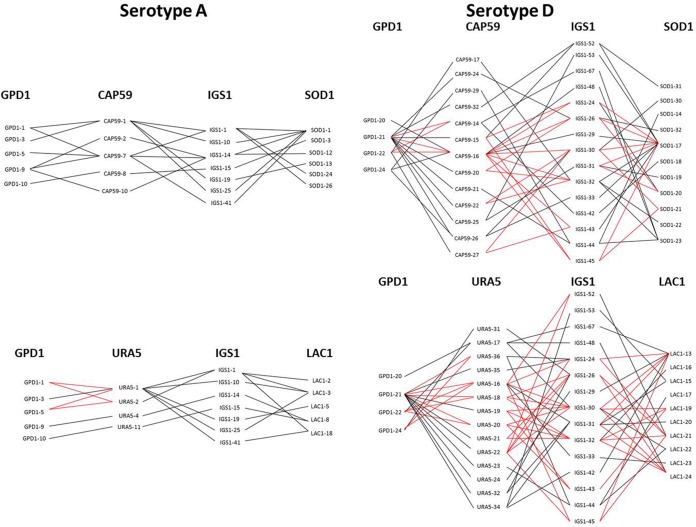
FIG 3 .
Comparison of allelic compatibility tests generated for serotype A and serotype D. An hourglass shape (red lines) indicates the presence of all four possible pairs of alleles and serves as evidence of recombination. A selection of 6 out of the 21 tests is shown, demonstrating allelic compatibility in 1/6 tests for serotype A and 6/6 tests for serotype D. All graphs are provided in Fig. S1 in the supplemental material.

