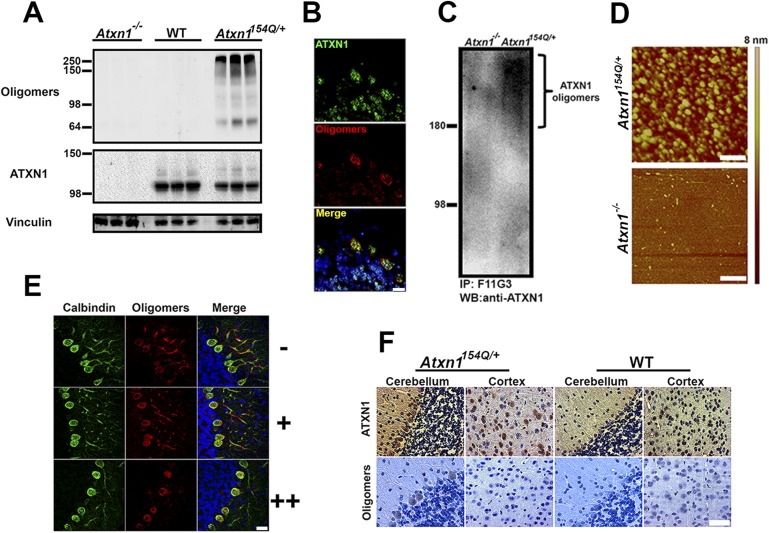
Figure 1. ATXN1 oligomers are located in areas prone to SCA1 degeneration.
(A) Western blot analysis of soluble fractions from cerebella shows the existence of amyloid oligomers exclusively in Atxn1154Q/+ mice model but in neither wild-type nor Atxn1−/− controls. (B) Immunofluoresence studies of Atxn1154Q/+ brain sections using anti-Ataxin-1 (green) and F11G3 (red) confirms the ATXN1 identity of the amyloid oligomers. Scale bar = 15 μm. (C) Western blot using anti-ATXN1 antibody showed that the isolated oligomers (IP with F11G3), were indeed ATXN1 oligomers. These ATXN1 oligomers were IP’d exclusively from Atxn1154Q/+ mouse cerebellum and not from Atxn1−/− controls. (D) AFM analysis showing brain-derived ATXN1 oligomers IP from Atxn1154Q/+ mouse using F11G3. Scale bar 200 nm. (E) Double staining using the Purkinje cell (PC) marker, calbindin (green) and F11G3 (red) revealed that ATXN1 oligomers accumulate in PC dendrites before dendritic degeneration is observed (top panel). With progression of dendritic degeneration, ATXN1 oligomers tend to accumulate in both the cytoplasm and nucleus (middle and bottom panel). Scale bar 30 μm. No degeneration is represented by (−), a low level of degeneration is represented by (+), and advanced degeneration by (++). Mice analyzed were 28 weeks old. (F) Histological staining for ATXN1 (top panel) and oligomers (F11G3, bottom panel) in cerebellum and cortex of Atxn1154Q/+ (left panels) and WT mice (right panels). Scale bar 50 μm.


