Figure 5.
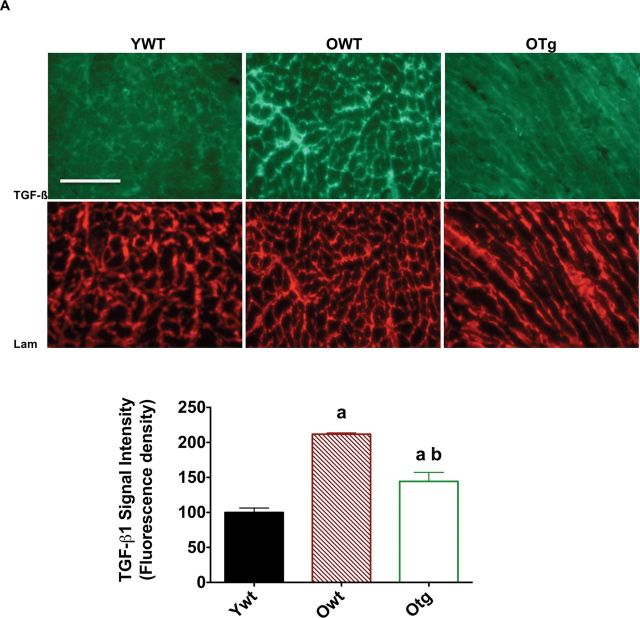
Transforming growth factor-β1 (TGF-β1; top) and laminin (bottom; A) are visualized by immunofluorescence staining (×20), and TGF-β1 signal intensity is shown (B) in left ventricle samples of young adult wild-type (YWT), old WT (OWT), and old Sod2 Tg (OTg). Data are expressed as means ± standard error of the mean. “a” indicates a significant difference vs YWT (p < .05). “b” indicates a significant difference vs OWT (p < .05).

