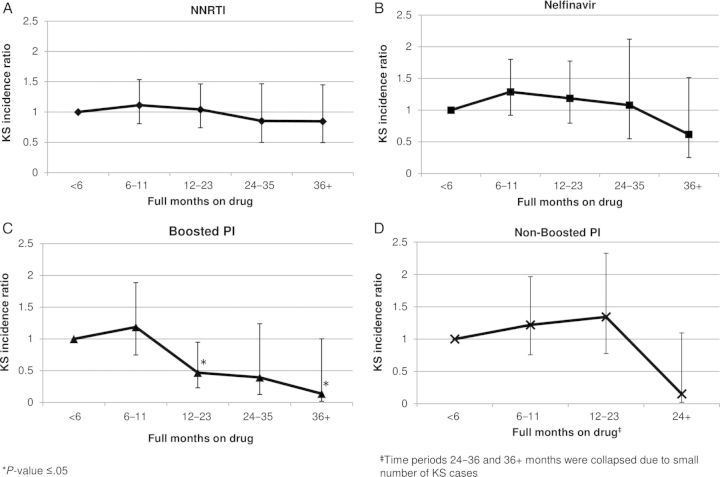
Figure 3.
Kaposi sarcoma (KS) incidence rate ratios by total duration of drug exposure for (A) nonnucleoside reverse transcriptase inhibitor (NNRTI), (B) nelfinavir, (C) boosted protease inhibitors (PIs), and (D) nonboosted PIs adjusted for age, race, comorbidities, total combination antiretroviral therapy (cART) exposure, human immunodeficiency virus (HIV) era, CD4 count, HIV viral load, time from initiating cART, and veterans health administration use.

