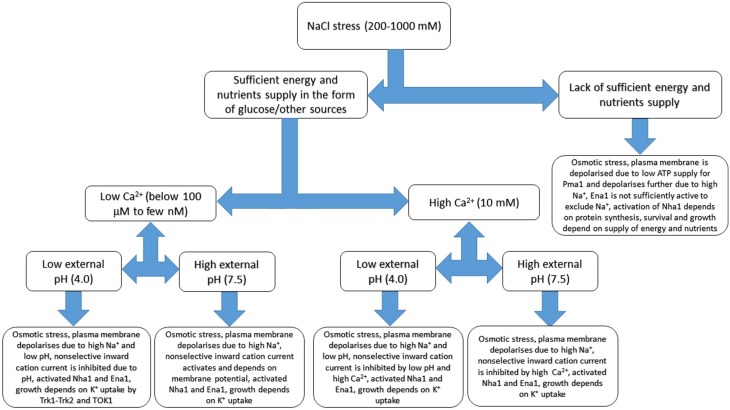
Figure 5.
Basic sketch of anticipated changes of ion transport in yeast cell under salinity treatment. Several additional factors including external calcium concentration, pH and sufficient energy supply are added. The scheme demonstrates complexity of responses and based on patch clamp and growth experiments, refers to membrane potential measurements and extrapolates some of the known results. Osmotic adaptation to compensate for rise of external osmotic pressure includes synthesis of compatible osmolytes and not shown at the Figure, while some responses could be more complex due to interactions between transport systems. More details are in the text, the given values are not exact and provided rather for indication. Continuous models with several parameters are outside the scope of the review being a special subject of study and research.

