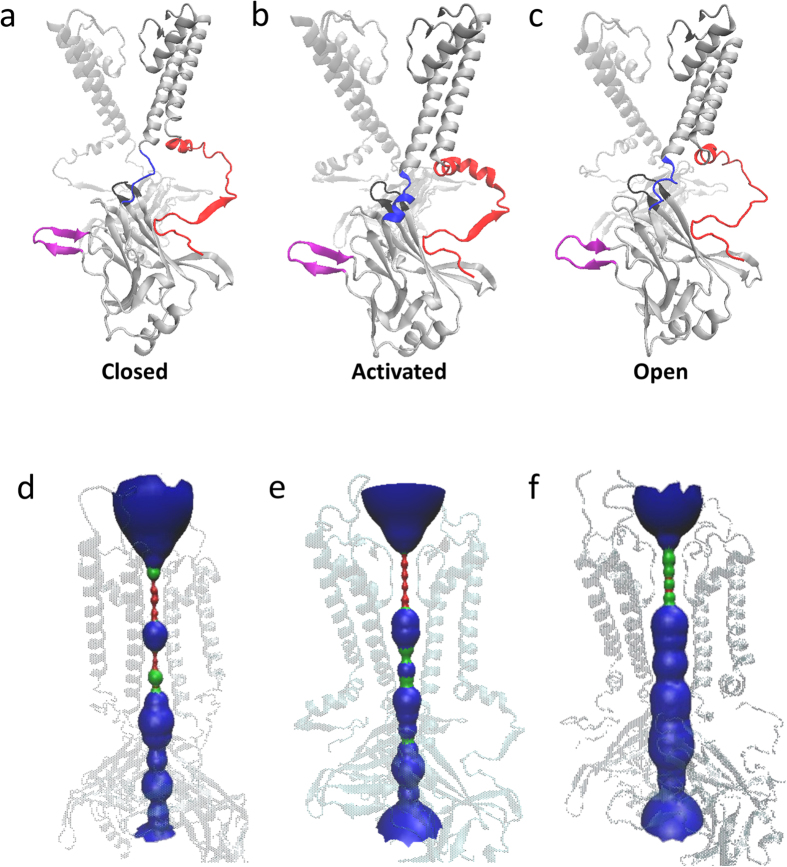
Figure 1. Schematic diagrams of the structures of Kir2.1 in closed.
(a), activated (b) and open (c) states. C-linker, N-terminal and G-loop are highlighted as blue, red and black, respectively. (d–f) are the pore lining of closed, activated and open channel, respectively. The pore lining generated using HOLE is shown as a red (radius < size of water), green (radius ≈ size of water) and blue (radius > size of water). All the structures are generated using VMD.

