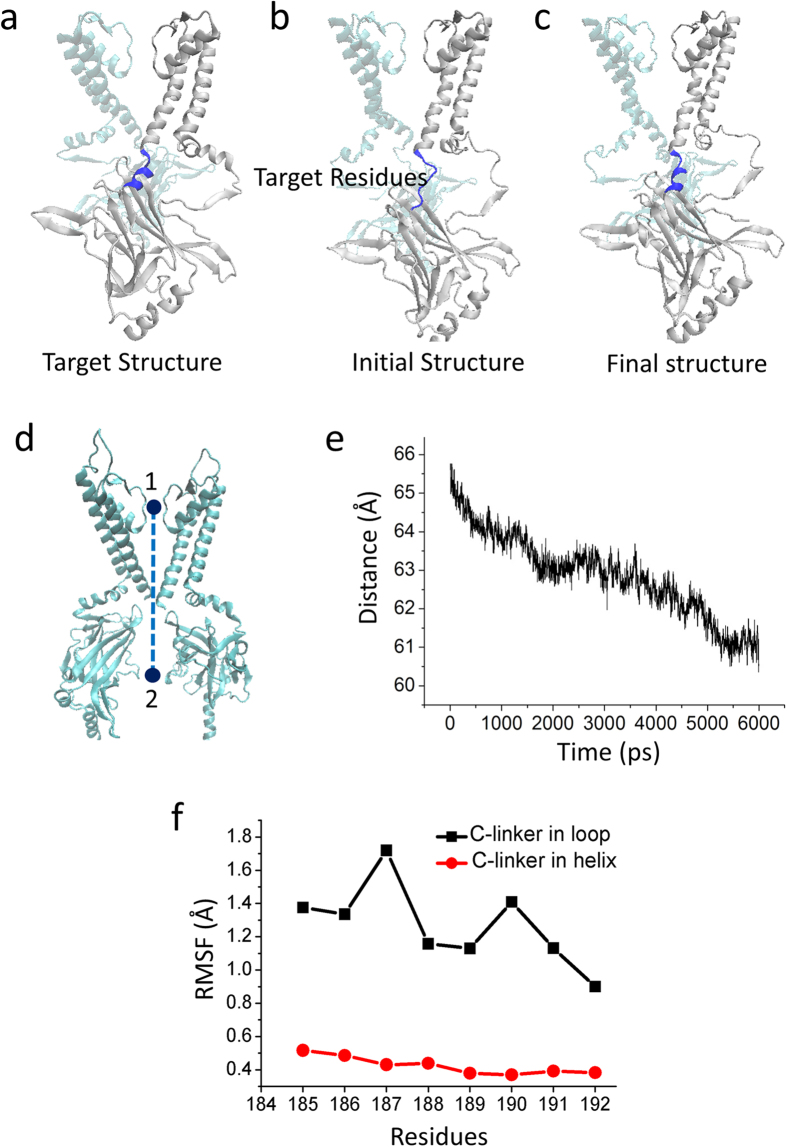
Figure 3. The CTD transfers 5 Å towards the TMD during the first Targeted MD simulation which focuses on the C-linker (blue).
(a) The schematic diagram of the targeted structure, which is in the activation state. (b) The schematic diagram of the initial structure, which is in the closed state. The target residues, to which the targeted force is applied (residues Lys185-Thr192), are colored blue. (c) The schematic diagram of the final conformation, which is achieved by the Targeted MD simulation. (d) Definition of the distance (R) which is from the center of the selectivity filter (the upper sphere) to the center of the C-terminal domain (CTD) (the lower sphere). (e) Evolution of the distance R vs. time. (f) RMSFs of the residues in C-linker, when the conformation of the C-linker is in the helical (black) and in the loop states (red).

