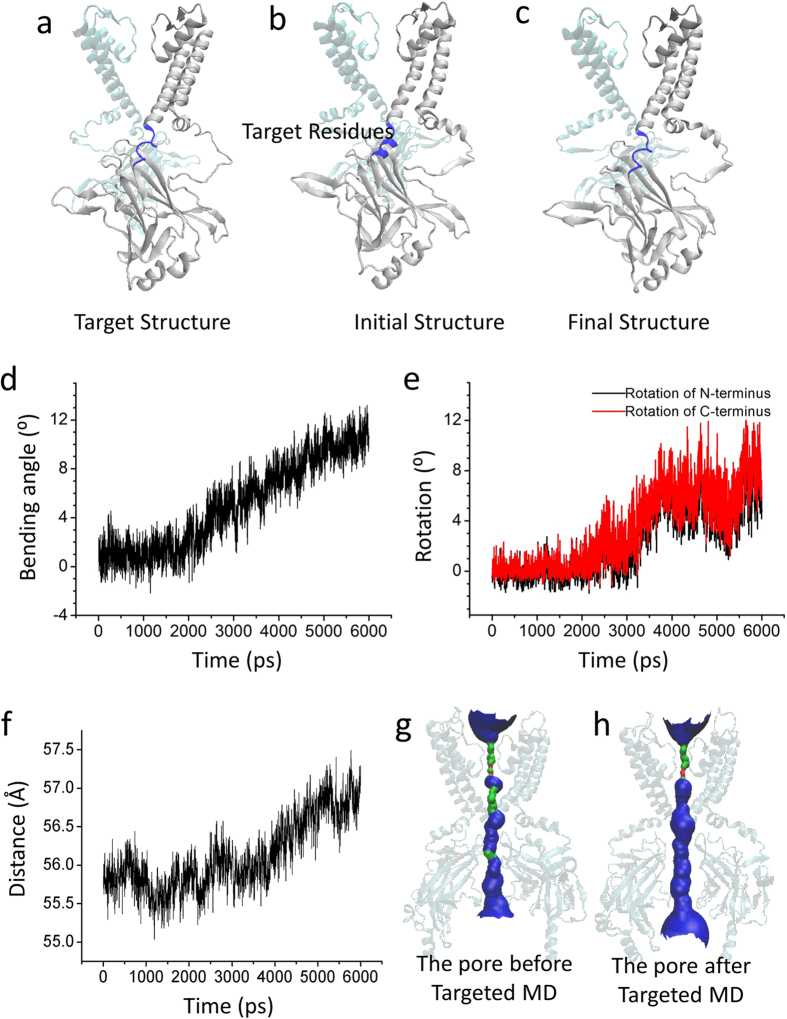
Figure 4. The rotation of CTD pulls the channel to the open state.
(a) The schematic diagram of targeted structure, which is in the open state. (b) The schematic diagram of the initial structure, which is in the activated state. The target residues, to which the targeted force is applied (residues Lys185-Thr192 and PIP2 binding sites), are colored blue. (c) The schematic diagram of the final conformation, which is achieved by our last Targeted MD simulation. (d) The time course of the kinking of the C-linker. (e) The time course of the rotation of the N- (black) and C-termini (red). There is an 8° rotation-angle of the CTD the during Targeted MD simulation. (f) The distance, R, vs. the simulation time. (g) and (h) show the schematic pore lining by Kir2.1 (generated using HOLE) for the initial-activated state and the final conformations achieved by the simulations, respectively. The pore lining generated using HOLE is shown as a red (radius < size of water), green (radius ≈ size of water) and blue (radius > size of water).

