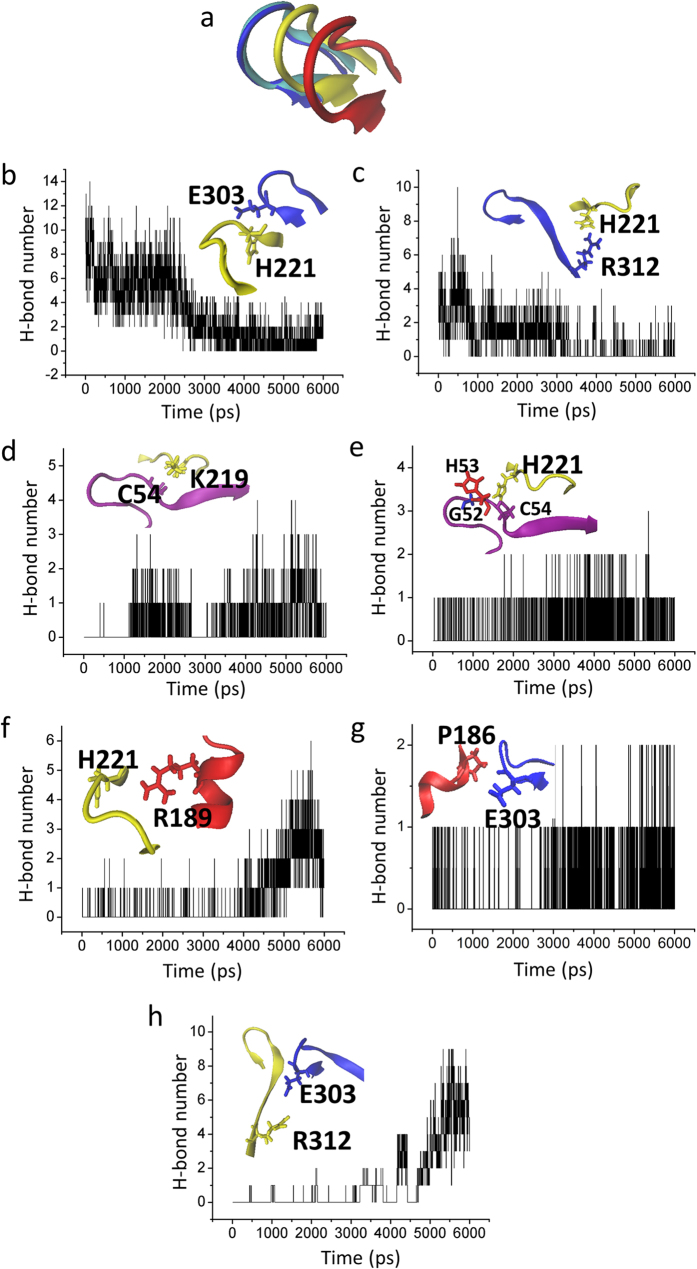
Figure 6. The interaction network that opens the G-loop gate.
(a) The distinct conformations of G loop at 0 ns (blue), 2 ns (silver), 3 ns (yellow), and 6 ns (red) during the Targeted MD simulation. (b) and (c) show the time course of the interaction between G-loop (blue) and CD-loop (yellow) through intrasubunit E303-H221 (b) and intersubunit R312–H221 (c). (d) and (e) show the time course of interactions between N-terminus (purple) and CD-loop (yellow) through C54–K219 (d) and G52/H53/C54-H221 (e). (f–h) show the strengthened interactions between CD-loop (yellow) and C-linker (red) through H221–R189 (f), between C-linker (red) and G-loop (blue) through P186–E303 (g) and between adjacent G-loops through E303–R312 (h).

