
Figure 2.
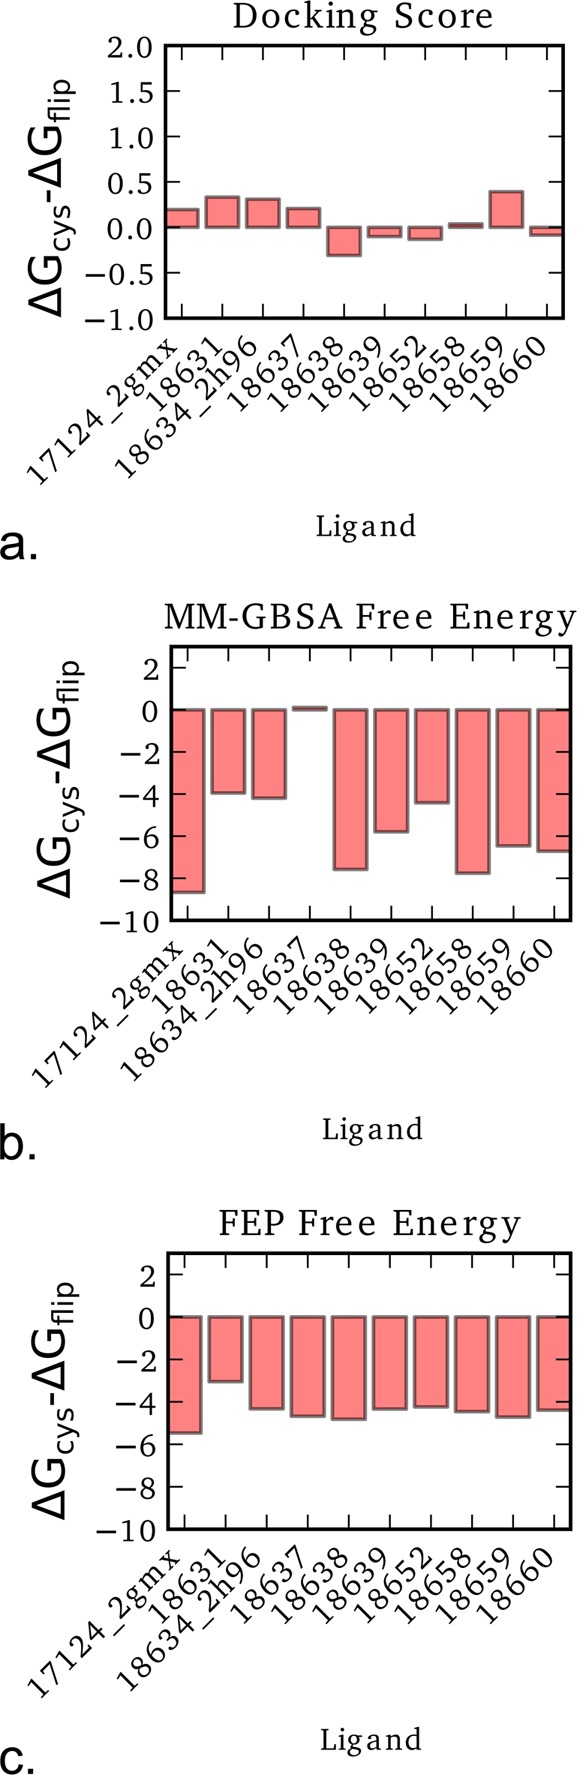
Difference in the docking score or predicted free energy values in kcal/mol for the R1 methoxy ligands in the crystal binding mode (ΔGcys) and the flipped conformation (ΔGflip). Results are shown for (a) Glide docking, (b) MM-GBSA, and (c) FEP calculated free energies. Values below zero indicate that the crystal binding mode is more favored, matching the expected result.