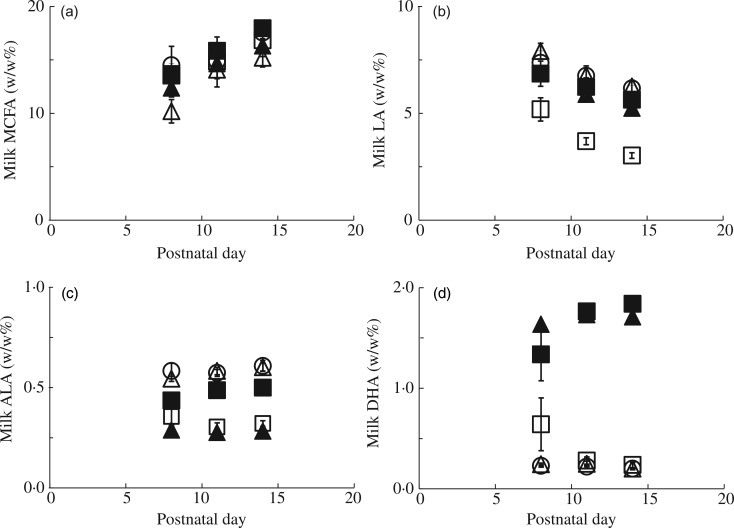
Fig. 3.
Changes in milk fatty acid (FA) composition over time in lactating mice fed different dietary FA composition. Milk medium-chain FA (MCFA) (a), linoleic acid (LA) (b), α-linolenic acid (ALA) (c) and DHA (d) concentrations during lactation (from postnatal day (PN) 7to PN15) of dams fed a control (○), MCFA (Δ), n-3 long-chain PUFA (LCP) (▲), n-3 LCP/MCFA (█) or low-LA (☐) diet between PN2 and PN28. Concentrations are represented as wt% of total FA. Values are means (n 5 for all groups), with standard errors represented by vertical bars.

