
Fig. 6.
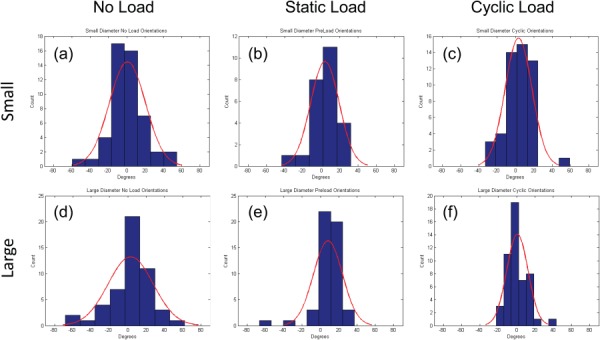
Histogram of the distribution of cell orientations relative to the mean for: (a)–(c) small and (d)–(f) large diameter fiber meshes. Orientations were determined after the third daily application of mechanical stimulation and panels correspond to: (a) and (d) no load, (b) and (e) static load, and (c) and (f) cyclic load. Curve corresponds to the best fit of a wrapped normal distribution based on angular standard deviations of: (a) 18.8 deg, (b) 14.8 deg, (c) 13.9 deg, (d) 22.9 deg, (e) 13.9 deg, and (f) 11.3 deg. (These numbers are plotted in Fig. S2(c) (Supplemental figures are available under the “Supplemental Data” tab for this paper on the ASME Digital Collection)).