
Fig. 7.
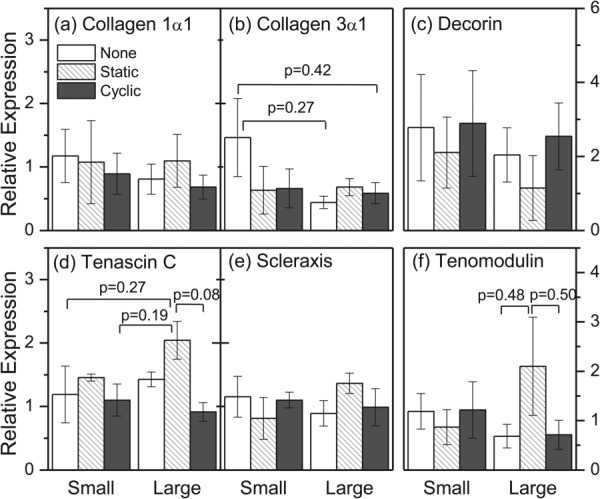
Relative gene expression of tendon/ligament primary collagens ((a) and (b)), tendon/ligament matrix accessory genes ((c) and (d)), and tendon/ligament selective genes ((e) and (f)) after 3 days of no load, static load, or cyclic load culture on electrospun polyurethane meshes with mean fiber diameter size of 0.60 μm (small) or 1.74 μm (large). Bars correspond to the mean ± SEM for n = 4 for all groups except for small fiber diameter meshes group, static load, where n = 2.