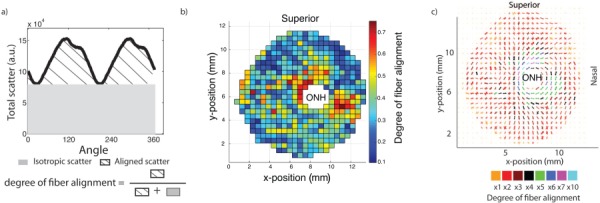
Fig. 2.

(a) Angular intensity profile for a single WAXS measurement located in the peripapillary sclera. The degree of fiber alignment, which was defined as the ratio of the aligned scatter to the total scatter, was calculated for each WAXS measurement and is mapped in (b) for FC74l. Scatter intensity plots from (a) can be represented as polar plots indicating the local preferred orientation (shape of the plot) and the degree of fiber alignment and assembled into polar plots as shown in (c).
