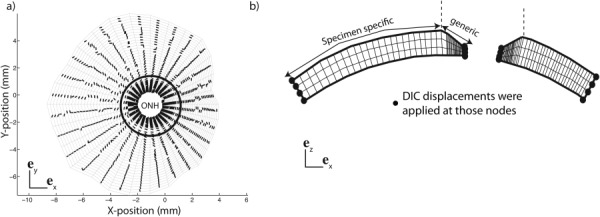
Fig. 3.

(a) Camera view of the specimen-specific mesh used for the inverse method for the specimen FC74l. The preferred fiber direction is represented for each element. (b) Side view showing the thickness variation close to the ONH. The thickness profile was created by linearly interpolating the 16 pachymeter measurements, made at two meridional positions and eight circumferential positions. The midposterior sclera was constructed from the DIC-measured position of the surface and the thickness data. DIC-displacements were applied at the edges of the mesh as kinematic boundary conditions. The boarder between the specimen-specific region and the generic region is marked with a circle in (a) and a vertical dashed line in (b).
