Fig. 6.

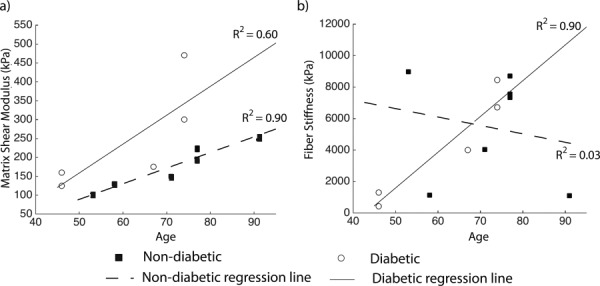
( a) Matrix shear modulus μ, (b) fiber stiffness 4αβ plotted versus age for diabetic and non-diabetic donors. Regression lines represent the age-related variation in stiffness within the diabetic and non-diabetic groups.

( a) Matrix shear modulus μ, (b) fiber stiffness 4αβ plotted versus age for diabetic and non-diabetic donors. Regression lines represent the age-related variation in stiffness within the diabetic and non-diabetic groups.