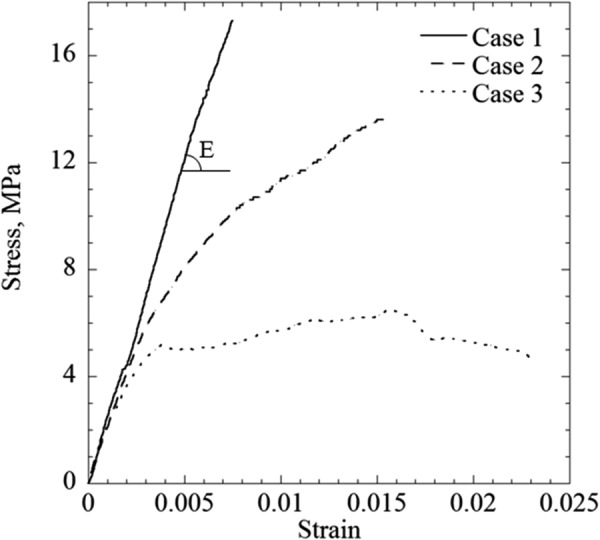
Fig. 6.

Three typical stress–strain curves obtained in the current study: (case 1) representing the linear-elastic behavior found for specimens permeated with all solutions except for the cocktail DP6 + PEG400; (case 2) a possibly hardening specimen, permeated with DP6 + PEG400; and (case 3) a specimen permeated with DP6 + PEG400, possibly exhibiting viscous flow or plastic deformations
