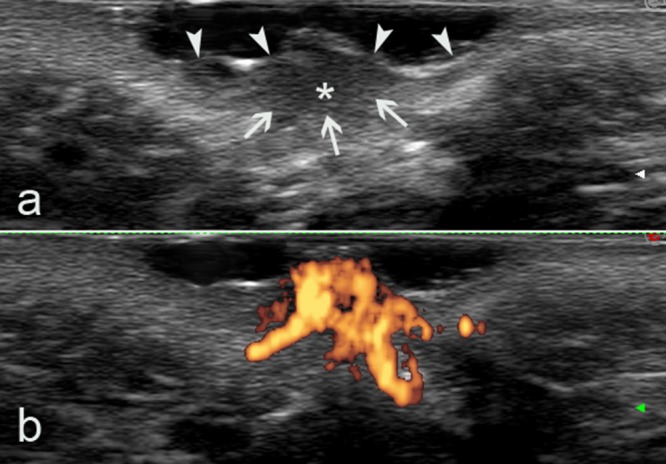
Figure 3.

(A) Gray-scale ultrasound image clearly showing a thickened hypoechoic area (asterisk) due to inflammation. The deep margins of the lesion are not well defined (arrows), nor is the dermalsubdermal interface. Arrowheads indicate the epidermal interface. (B) Power Doppler ultrasound image showing an evident increase in PD signal in the hypoechoic area, confirming high blood flow, probably due to vessel dilation due to inflammation. [Copyright: ©2015 Lamberti et al.]
