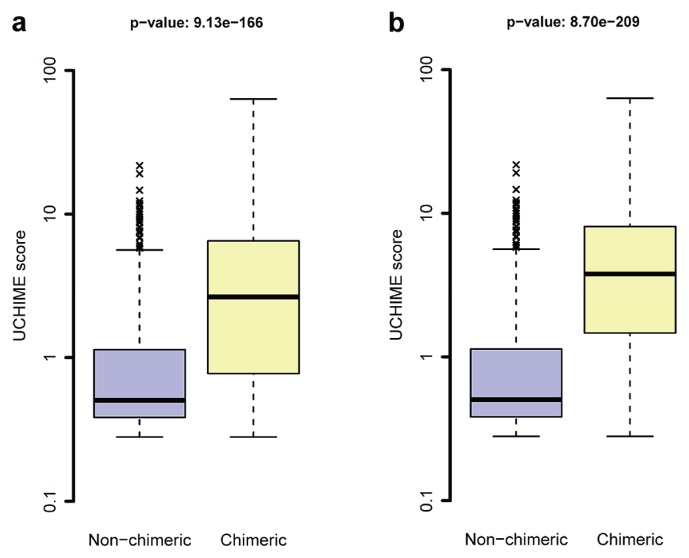
Fig. 2.
Boxplots of UCHIME scores for non-chimeric and chimeric sequences. All sequences were included in panel (a), while sequences with low read quality were removed in panel (b). The score difference between the non-chimeric and chimeric sequences was statistically assessed through the Wilcoxon-Mann-Whitney test.

