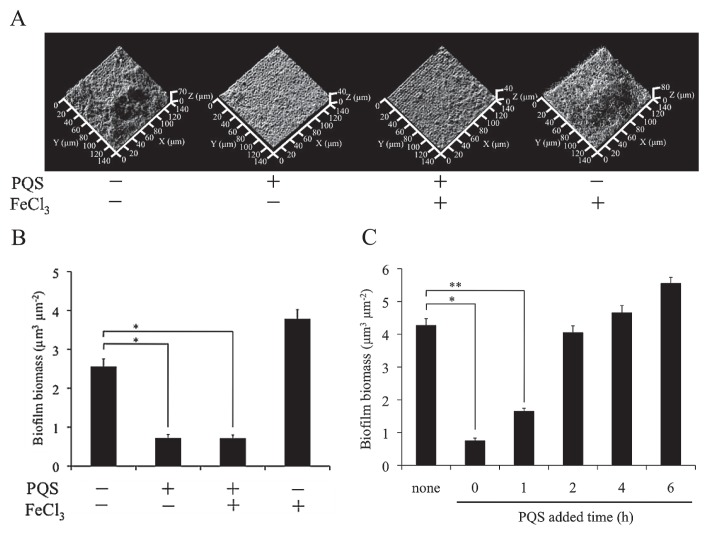
Fig. 2.
Effects of the PQS on biofilm formation. (A) Observation of the biofilm structure on HA surfaces. The visualization was performed by confocal reflection microscopy. At least five pictures were taken per sample and representative pictures were shown. (B) Quantification of the microscopic image shown in (A). Quantification was performed using the COMSTAT program (2). *P<0.01 (t-test) (C) Effects of the time-of-addition of the PQS on the inhibition of biofilm formation by S. mutans. The PQS was added at the time indicated on the X-axis, and the biofilm was then allowed to form for a total of 12 h. Biofilms were incubated in TSB medium at 37°C for 12 h. The PQS was added to the cultures at a final concentration of 50 μM, and, in panels A and B, FeCl3 was added at a final concentration of 150 μM. respectively. The averages are based on three or more independent determinations, and the standard errors are indicated. *P<0.01, **P<0.05 (t-test). The data shown are representative of three independent experiments.

