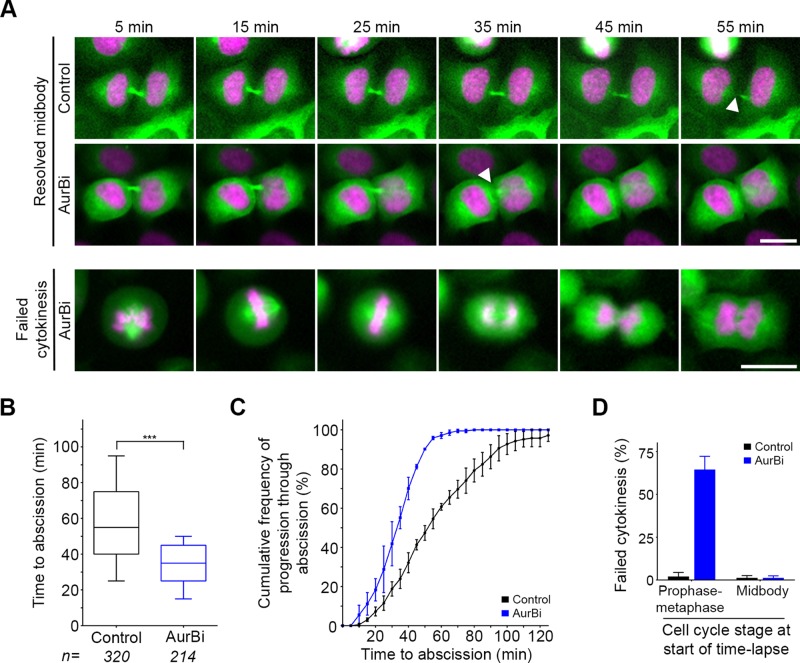
FIGURE 2:
Assay to assess abscission timing. (A) HeLa cells expressing GFP-tubulin (green) and H2B-mCherry (magenta) were subjected to time-lapse imaging every 5 min for 2 h. Time to abscission (midbody disassembly; white arrowheads) was quantified for all cells in midbody stage at the beginning of each movie. Either DMSO (Control) or Aurora B inhibitor (AurBi) was added to cells immediately before imaging. Cells that were in mitosis (prophase–metaphase) at the time of AurBi exposure were prone to cytokinesis failure as illustrated. (B) Time to abscission was quantified for all midbody-stage cells. Boxplot represents the 25th, median, and 75th percentile of values from the indicated treatments (n = number of cells per treatment, combined from three to five independent experiments). Whiskers represent the 10th and 90th percentiles. ***p < 0.0001 (Mann–Whitney test). (C) Cumulative frequency plots of progression through abscission. Each point represents the percentage of all midbody cells analyzed in C that had proceeded through abscission over the time course of the experiment. Error bars represent the mean and SD from three to five independent experiments per treatment. (D) Quantification of failed cytokinesis in mitotic (prophase–metaphase) cells and midbody-stage cells in the presence or absence of Aurora B inhibitor.

