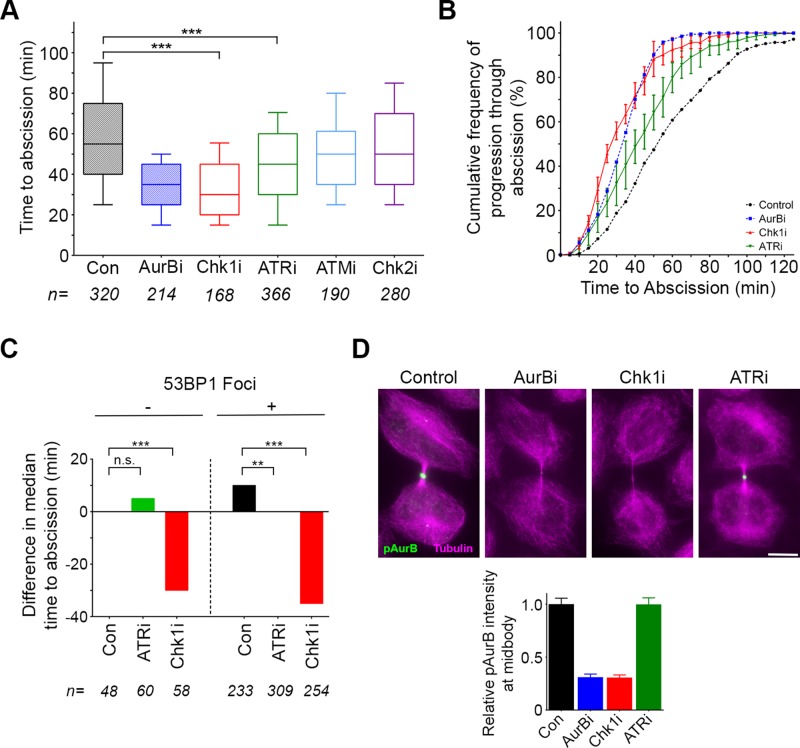
FIGURE 5:
ATR and a Chk1-Aurora B pathway coordinate postmitotic genome surveillance with abscission timing. (A, B) Quantification of abscission timing using the time-lapse imaging assay in Figure 2. Control and AurBi data from Figure 2 are included for comparison. ***p < 0.0001. (C) HeLa cells expressing GFP-tubulin and mCherry-53BP1-FFR were subjected to time-lapse imaging, and abscission timing was quantified for cells with and without 53BP1 foci in the presence or absence of the indicated inhibitors. The difference in median time to abscission compared with cells negative for 53BP1 foci (which take a median time of 50 min) is indicated. **p < 0.01; ***p < 0.0001. (D) HeLa cells were treated for 15 min with the indicated inhibitors and analyzed for localization of Aurora B-pT232 (green) at the midbody (α-tubulin, magenta). Graph represents quantification of Aurora B-pT232 fluorescence intensity after each treatment compared with control. Error bars indicate SEM. Scale bar, 10 μm.

