FIGURE 5:
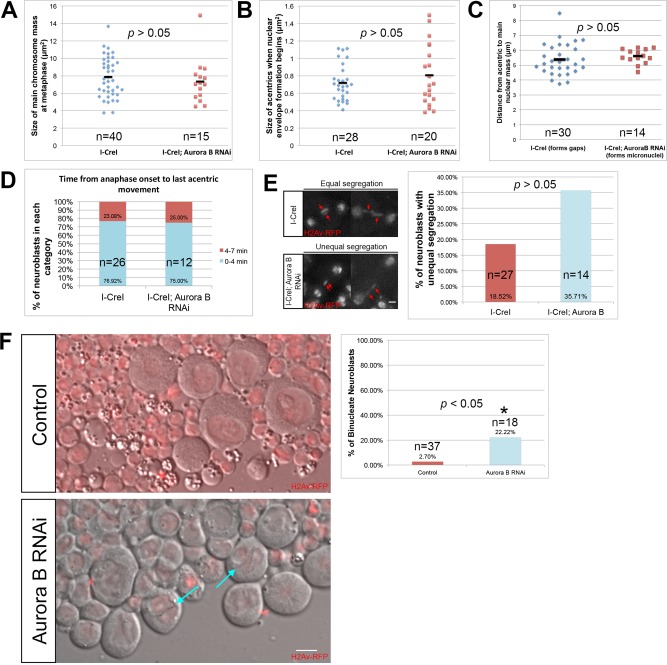
Aurora B RNAi does not lead to gross changes in chromosome behavior or structure. (A) Measured size of undamaged chromosomes in I-CreI–expressing control (cyan triangles) and I-CreI; Aurora B RNAi neuroblasts (red squares) at the moment of maximal metaphase compaction. (B) Measured size of acentrics generated in I-CreI neuroblasts (cyan triangles) and I-CreI; Aurora B RNAi neuroblasts (red squares) at the beginning of NEF. (C) Distance between acentrics and the main chromosome mass in gap-forming, I-CreI–alone (control) neuroblasts (cyan triangles) and non–gap-forming I-CreI; Aurora B RNAi neuroblasts (red squares) after completion of anaphase. (D) Timing of the initiation of acentric poleward segregation after onset of anaphase in both I-CreI–alone (control) and I-CreI; Aurora B RNAi neuroblasts. The timing of the initiation of acentric poleward segregation was grouped into two categories: 0–4 min (cyan bars) and 4–7 min (red bars). (E) Still images from time-lapse movies of equal (top) and unequal (bottom) segregation of acentrics during anaphase in neuroblasts expressing I-CreI alone (top) or I-CreI plus Aurora B RNAi (bottom). Red arrows show acentrics. Scale bar, 2 μm. Right, graph of the percentage of unequal segregation in both types of neuroblasts. A statistically nonsignificant increase in unequal segregation of acentrics in I-CreI with Aurora B RNAi neuroblasts vs. I-CreI alone (control) neuroblasts was observed. (F) Single-frame pictures of third-instar neuroblasts from wild-type larvae (top) and larvae in which Aurora B is reduced (bottom). Right, graph of the percentage of binucleate neuroblasts in both types of larvae. Cyan arrows point to binucleate cells. Red channel is H2Av-RFP. Gray channel is differential interface contrast (DIC). Scale bar, 6 μm. p values were calculated by independent t test with equal variances not assumed.

