FIGURE 3:

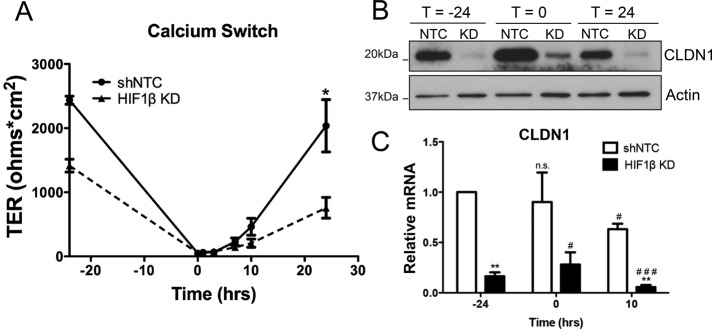
Expression and function of CLDN1 in HIF1β KD epithelia during barrier assembly. (A) shNTC and HIF1β KD T84 cells were subjected to Ca2+ switch, and TER was monitored over time. (B) Western blotting at various time points revealed a slight increase in CLDN1 expression at t = 0 and then repression at t = 24 in both shNTC and HIF1β KD. (C) RT-PCR analysis indicates no increase in transcript at t = 0, with a significant decrease in transcript at t = 10. *Relative to shNTC, #relative to shNTC, t = 0. *p < 0.05, **p < 0.01, and ***p < 0.001 as determined by Student's t test. In all cases, n = 3 independent experiments.
