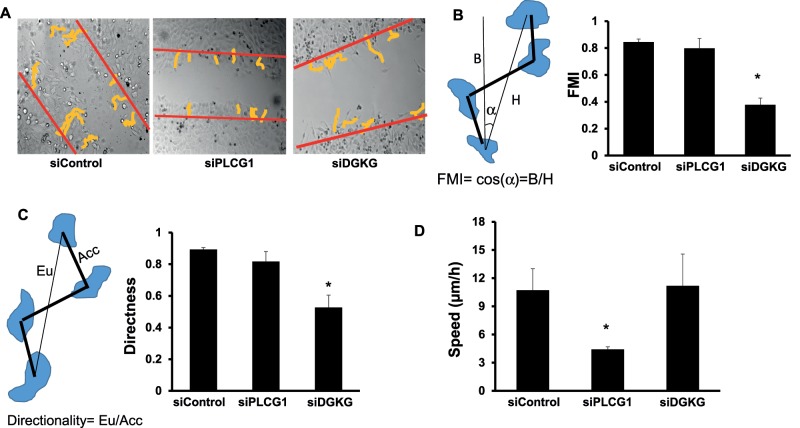
FIGURE 3:
(A) HeLa cells transfected with the indicated siRNA were live imaged over a period of 10 h, and individual cells were tracked using ImageJ. Tracks were colored yellow to enhance visibility. Red lines indicate the position of the wound at start of recording. (B) Measurement of the FMI in the indicated conditions. Left, schematic explaining the FMI and how it is calculated. (C) Measurement of the directness of migration in the indicated conditions. Left, schematic explaining the migration directness and how it is calculated. (D) Measurement of the speed of migration in the indicated conditions. Values in B–D are means ± SD from three independent experiments in which between 100 and 118 individual cells were tracked per condition. Asterisks indicate statistically significant differences from control (p < 0.01).

