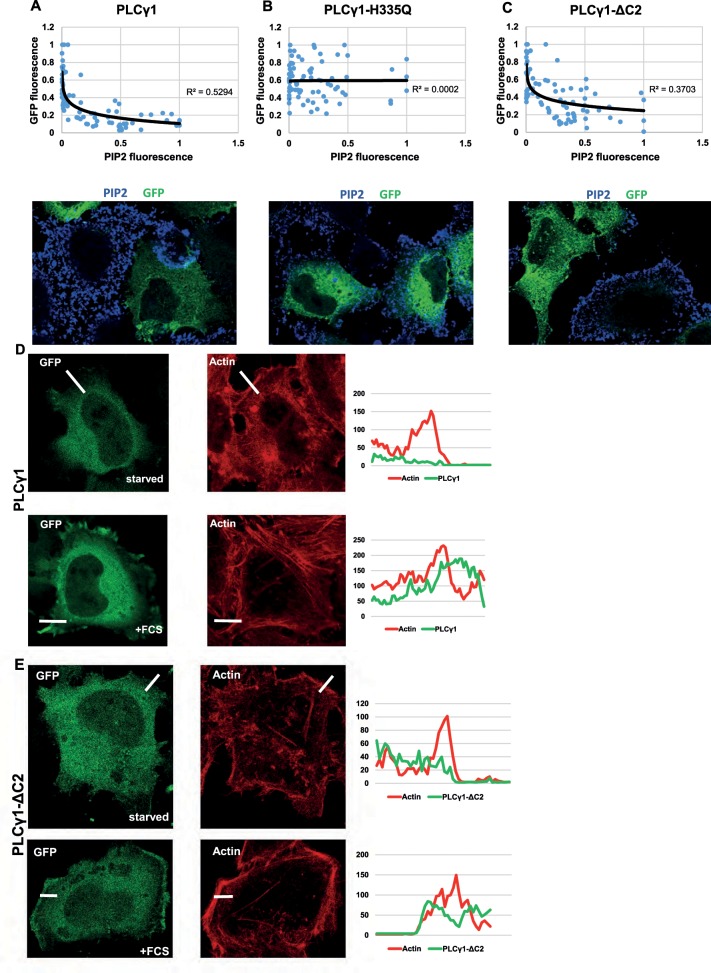
FIGURE 6:
(A–C) HeLa cells were transfected with GFP-tagged version of wild-type PLCG1 (A), the catalytically inactive mutant PLCG1-H335Q (B), and the truncation mutant PLCG1-ΔC2 (C). After 24 h, cells were fixed, and PI(4,5)P2 was stained by immunofluorescence. The total fluorescence over the entire cells in the GFP channel (level of PLCG1 versions) was plotted against the fluorescence of PI(4,5)P2. Top, graphs showing the results. Each dot is an individual cell with the coordinates of the two fluorescence intensities. Bottom, representative images. (D, E) HeLa cells were transfected with wild-type PLCG1 (D) or PLCG1-ΔC2 (E). After 24 h, cells were fixed and labeled with Alexa Fluor 647–phalloidin to label F-actin. Starved, cells serum starved for 2 h. +FCS, cells serum starved followed by stimulation with 10% FCS for 10 min before fixation. A region at the border of the cells was used to measure fluorescence intensity (white line), which is plotted on the right.

