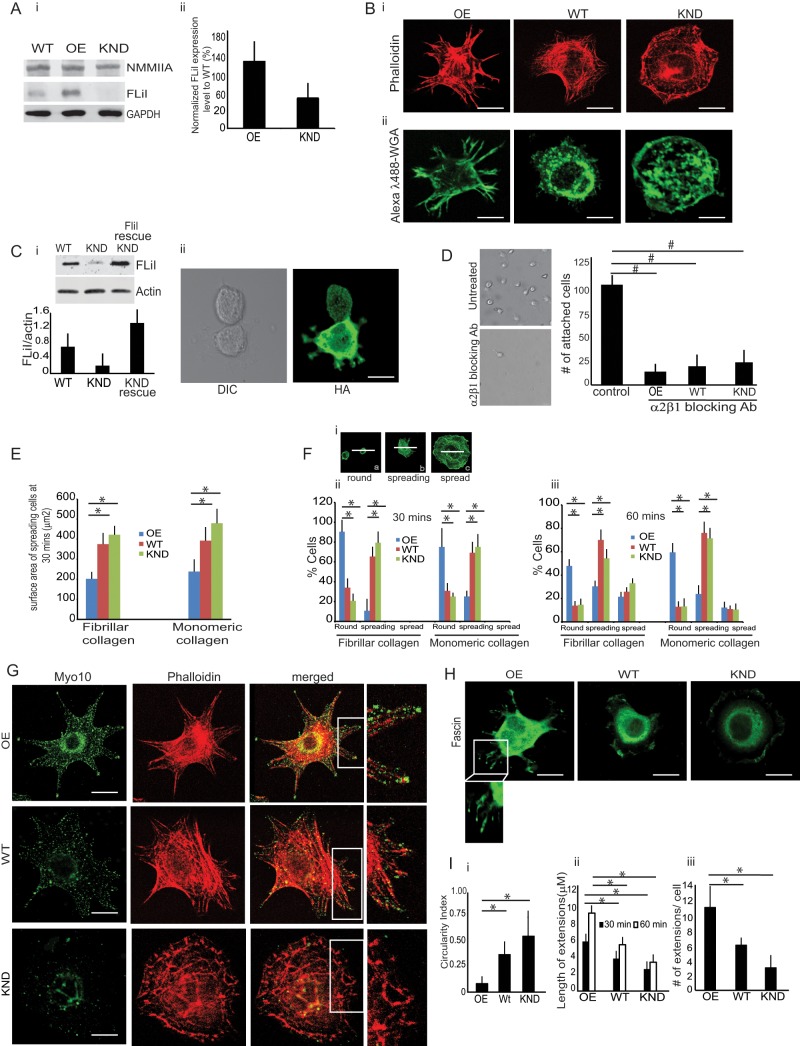
FIGURE 1:
Characterization and phenotypes of FliI cells. (A) (i, ii) FliI protein expression levels in FliI OE, WT, and KND cells. Compared with FliI WT cells, FliI OE cells show 170% increase of FliI expression, and FliI KND cells show 41% reduction of FliI. Histogram shows quantification of average blot density in Western blots. Experiments were repeated four times with similar results. (B) (i) FITC-phalloidin–stained cells show distinct phenotypes with different cell surface morphologies when plated on fibrillar collagen. FliI KND cells are characterized by a flat, evenly spread, smooth-edged phenotype. FliI OE cells show prominent filopodia with long, actin-containing protrusions. (ii) Cells stained with Alexa 488 wheat germ agglutinin (WGA) to show outline of cell membrane of vital cells. (C) (i) Rescue experiment in which WT FliI-HA was introduced into FliI KND cells. shRNA-resistant construct was transfected into KND cells to block RNA-mediated silencing of FLiI. (ii) Cells transfected with rescue construct exhibit different morphology from FliI KND cells and show longer cell extensions. Experiments were repeated three times. (D) Left, representative images of cells treated with blocking antibody or irrelevant (nebulin antibody). Right, data in histogram show effect of α2β1 blocking antibody on cell attachment. Data are reported as mean ± SD, n = 3, at least 50 cells per group; #p < 0.02 using ANOVA and comparing antibody with control (irrelevant antibody–treated) cells. (E) Projected surface area of spreading FliI KND cells is twofold higher than FliI OE cells on fibrillar or monomeric collagen. Data are reported as mean ± SD, n = 3, with at least 40 cells/group. *p < 0.05 using ANOVA and comparisons between OE with WT or KND cells. (F) (i) Representative images showing round (a), spreading (b), or spread cells (c) as a function of time after plating. Rounded cells have twice the diameter of spreading cells. (ii, iii) FliI OE, WT, and KND cells plated on fibrillar or monomeric collagen. At 60 min, the initial spreading process was largely complete, and there were lower percentages of spread FliI OE cells than WT or FliI KND cells. (G) FLiI OE, WT, and KND cells immunostained for endogenous Myo10 show localized staining at tips of filopodia in FliI OE cells and punctate staining at peripheries of KND cells. (H) Fascin-immunostained cells show localization of fascin to filopodial cell extensions in FliI OE cells. (I) (i) Quantitative analysis of circularity index indicates that KND and WT cells are more circular and are less irregular on their contours than are OE cells (*p < 0.05 by ANOVA; n = 3 experiments/group, with >40 cells analyzed/group). (ii, iii) Histograms show mean ± SD of length and number of cell extensions in OE, WT, and KND cells (n = 3 experiments/group, with at least 40 cells analyzed/group.*p < 0.05 are comparisons of OE with WT and KND cells by ANOVA.

