FIGURE 4:
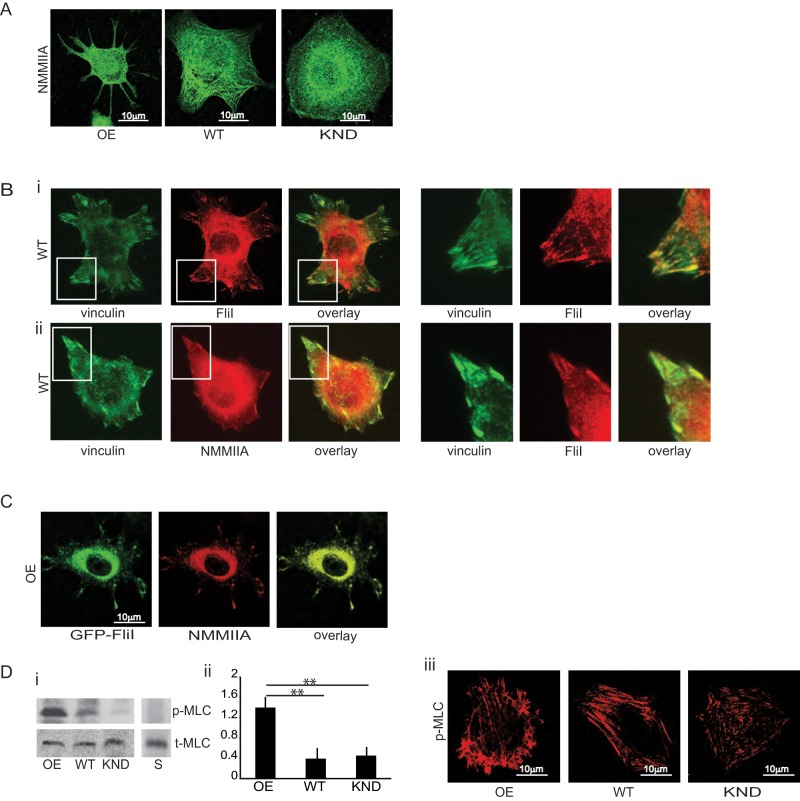
Colocalization of FliI with NMMIIA. (A) Representative images showing localization of nonmuscle myosin IIA in FliI OE, WT, and KND cells. Bar, 10 μm. (B) (i, ii) WT cells show colocalization of endogenous FliI and NMMIIA with vinculin. (C) FliI OE cells show colocalization of exogenous FLiI with NMMIIA at cell extensions. Bar, 10 μm. (D) (i, ii) Immunoblots were probed with an antibody to total myosin light chain (t-MLC) or to phospho-Ser-19 of myosin light chain (p-MLC) and show enhanced phosphorylation of p-MLC in FliI OE cells compared with WT and FliI KND cells. Data are reported as mean ± SD, n = 3, analyzed by ANOVA; **p <0.01 WT and KND cells compared with FliI OE cells as shown in the histogram. (iii) Images show immunostaining for phosphorylated myosin light chain in cells plated on fibrillar collagen (30 min). Bar, 10 μm.

