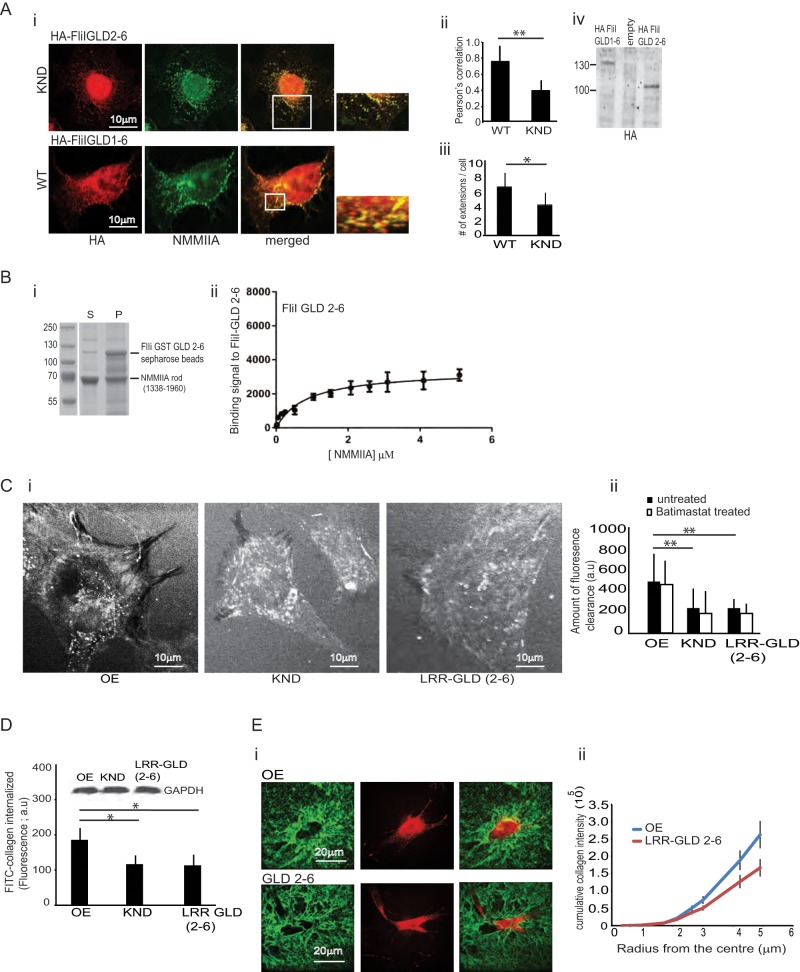
FIGURE 7:
Role of GLD domain 1 in cell function. (A) (i) FliI KND cells transfected with HA-FliI GLD 2–6 show reduced numbers of cell extensions and greatly diminished colocalization of FliI and NMMIIA. Cells transfected with HA-GLD 1–6 show colocalization of FLiI and NMMIIA at cell attachment sites. (ii) Pearson's correlation was applied to image pairs of FliI and NMMIIA immunostained cells to estimate colocalization of these proteins using ImageJ. Data in histogram show 50% reduction of colocalization of FLiI and NMMIIA in FliI KND cells transfected with FliI GLD 2–6 compared with FliI KND cells transfected with FliI GLD 1–6. Data are reported as mean ± SD and analyzed by ANOVA from observations made on image pairs of 30 cells. **p < 0.01, FliI KND cells transfected with FliI GLD 2–6 compared with WT cells (FLiI GLD 1–6). (iii) Quantification of cell extensions in KND and WT cells transfected with HA-tagged FliI GLD 2–6 and GLD 1–6, respectively (p < 0.01). (iv) Immunoblot shows expression levels of transfected HA-tagged FliI GLD 1–6 and GLD 2–6 in WT and FliI KND cells, respectively. (B) Quantification of FliI binding to NMMIIA shows reduced binding of Sepharose GST FliI GLD 2–6 to purified NMMIIA (kD = 0.8584 μM). (C) (i, ii) Untreated FliI KND cells or FliI KND cells expressing FliI LRR-GLD 2–6 plated on FITC-collagen substrate for 4 h exhibit substantial reduction of substrate clearance (i.e., collagen uptake) compared with FliI OE cells. Quantification of substrate fluorescence is presented in histogram as mean ± SD, n = 3, analyzed by ANOVA; **p < 0.01, comparison of FliI KND and FliI KND cells transfected with LRR-GLD 2–6 cells to FliI OE cells. Batimastat (10 μM) treatment did not alter FITC-collagen substrate clearance. (D) Fluorimetric measurements of cell lysates with equivalent cell protein (inset) show that FliI LRR-GLD 2-6 expression does not enable collagen internalization. KND and FliI LRR-GLD 2–6 cells show reduced collagen internalization compared with FliI OE cells. Experiment repeated three times; data presented in histogram as mean ± SD using ANOVA. *p < 0.05, comparison of KND and FliI LRR-GLD 2–6 to FliI OE cells. (E) (i, ii) Images and quantification show that absence of FliI GLD 1 attenuates collagen compaction.

