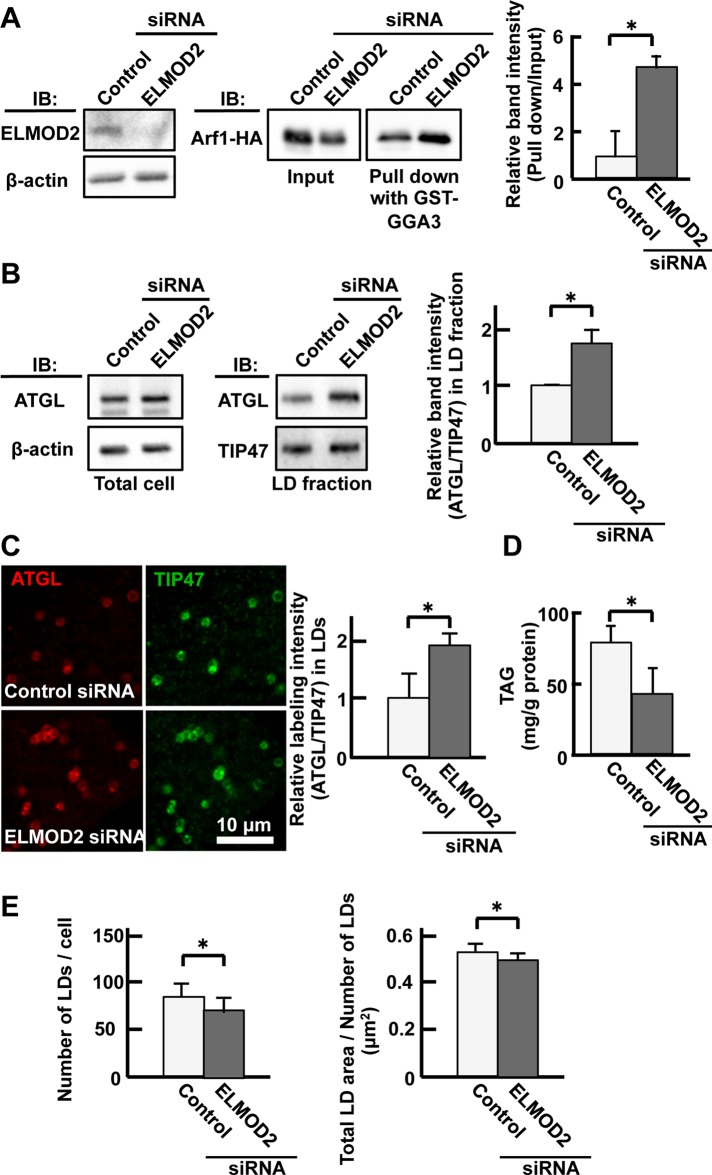
FIGURE 5:
Effect of ELMOD2 knockdown on Arf1 and ATGL. (A) GST-GGA3 pull down. Huh7 cells were transfected with either control or ELMOD2 siRNA. ELMOD2 was reduced significantly by RNAi (left panel). Arf1-HA precipitated with GST-GGA3 was increased significantly by ELMOD2 knockdown, indicating that ELMOD2 functions as an Arf1-GAP in the cell (middle panel). The relative reaction intensity of Arf1-HA pulled down with GST-GGA3 increased significantly after RNAi (right panel; mean ± SD; n = 3; Student's t test; *p < 0.05). (B) ATGL in LDs was increased by knockdown of ELMOD2. HeLa cells transfected with control or ELMOD2 siRNA were cultured with 0.4 mM OA for 12 h. The total cell and the LD fraction were examined by Western blotting. The expression level of ATGL in the cell was not influenced by ELMOD2 knockdown. The relative reaction intensity of ATGL to TIP47 in the LD fraction increased significantly after RNAi (mean ± SD; Student's t test; *p < 0.05). The experiment was repeated three times. (C) The increase of ATGL in LDs after ELMOD2 RNAi was confirmed by immunofluorescence labeling. HeLa cells transfected with control or ELMOD2 siRNA were doubly labeled for ATGL (red) and TIP47 (green). The relative labeling intensity of ATGL to TIP47 in LDs increased significantly after ELMOD2 knockdown (mean ± SD; Student's t test; *p < 0.05). The experiment was repeated three times, and in each experiment, 50 LDs chosen randomly from five micrographs were examined. (D) The TAG content was decreased by knockdown of ELMOD2. The total lipid was extracted from HeLa cells that were transfected with control or ELMOD2 siRNA and treated with 0.4 mM OA for 3 h. The amount of TAG was normalized to the protein content (mean ± SD; Student's t test; *p < 0.05). The experiment was repeated three times. (E) Both the number and size of LDs were decreased by knockdown of ELMOD2. HeLa cells were treated using the same protocol as in D and labeled with BODIPY493/503. LDs in 10 randomly taken micrographs were examined (mean ± SD; Student's t test; *p < 0.05).

