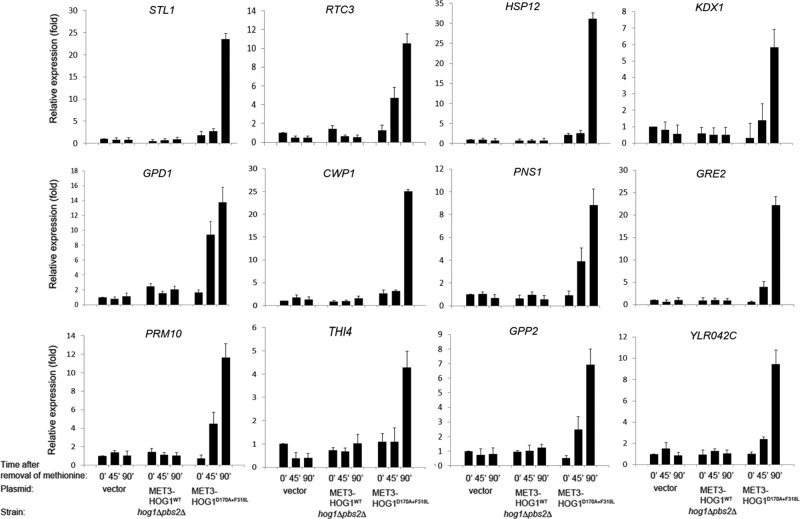
FIGURE 2:
Real-time quantitative RT-PCR analysis confirmed the microarray data for the 12 most highly induced genes. mRNA levels of the indicated genes were analyzed by real-time quantitative RT-PCR. The values were normalized to the levels of ACT1 mRNA, which served as an internal control. mRNA levels are presented as the ratio of their levels to those of the same genes at time 0 in cells harboring the empty vector. Experiments were performed in triplicate with two independent RNA preparations.

