Figure 1.
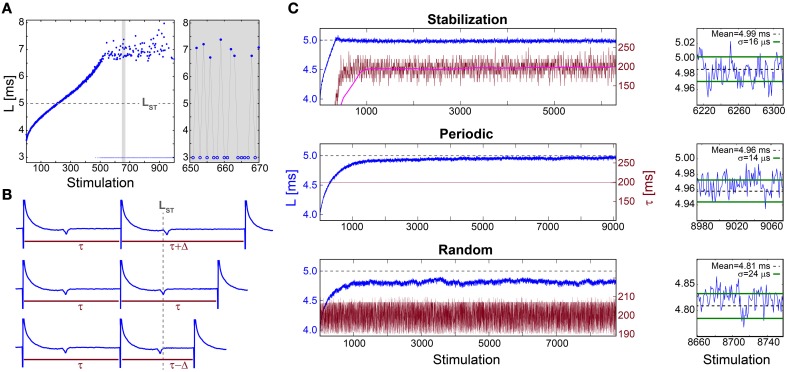
Stabilization of the neuronal response latency. (A) The NRL, L, (blue dots) of a cultured neuron stimulated at 30 Hz, with a guideline for stabilization at LST = 5 ms (gray dashed-line). Response failures (blue circles) are denoted at L = 3 ms, exemplified by a zoom-in (gray). A guideline for stabilization at LST = 5 ms is shown (gray dashed-line). (B) Schematic of a real-time adaptive algorithm for stabilization at LST. L(i) stands for the NRL to the ith stimulation, and τ (i) stands for the time-lag between the consecutive stimulations i-1 and i. In the event L(i)<LST the next time-lag between stimulations is shortened, τ (i + 1) = τ(i) −Δ (lower panel), whereas for L(i)>LST it is enlarged, τ (i + 1) = τ(i) +Δ (upper panel), otherwise it remains unchanged (middle panel). The step Δ is a predefined constant, which in advanced algorithms can be adjusted following the history of deviations from LST (not shown). (C) Stabilization of L (blue) at LST ~5 ms (gray dashed-line, also shown in A) and the time-lag τ between stimulations (crimson) for: the adaptive algorithm (described in B) using Δ = 20 ms, where the smoothed τ using 1000 Stimulation sliding window (pink) saturates at ~198 ms (upper panel), periodic stimulation with τ = 198.2 ms (middle panel) and τ taken randomly from U(190, 210) ms (lower panel). A zoom-in of L at the last 100 stimulations (blue) and the averaged L (black dashed-line) together with the standard deviation σ (green lines) obtained from the last 1000 stimulations for each stimulation scenario (right). All methods indicate a supreme stabilization, σ/L < 10−2. All experiments shown in this figure were done on a cultured neuron.

