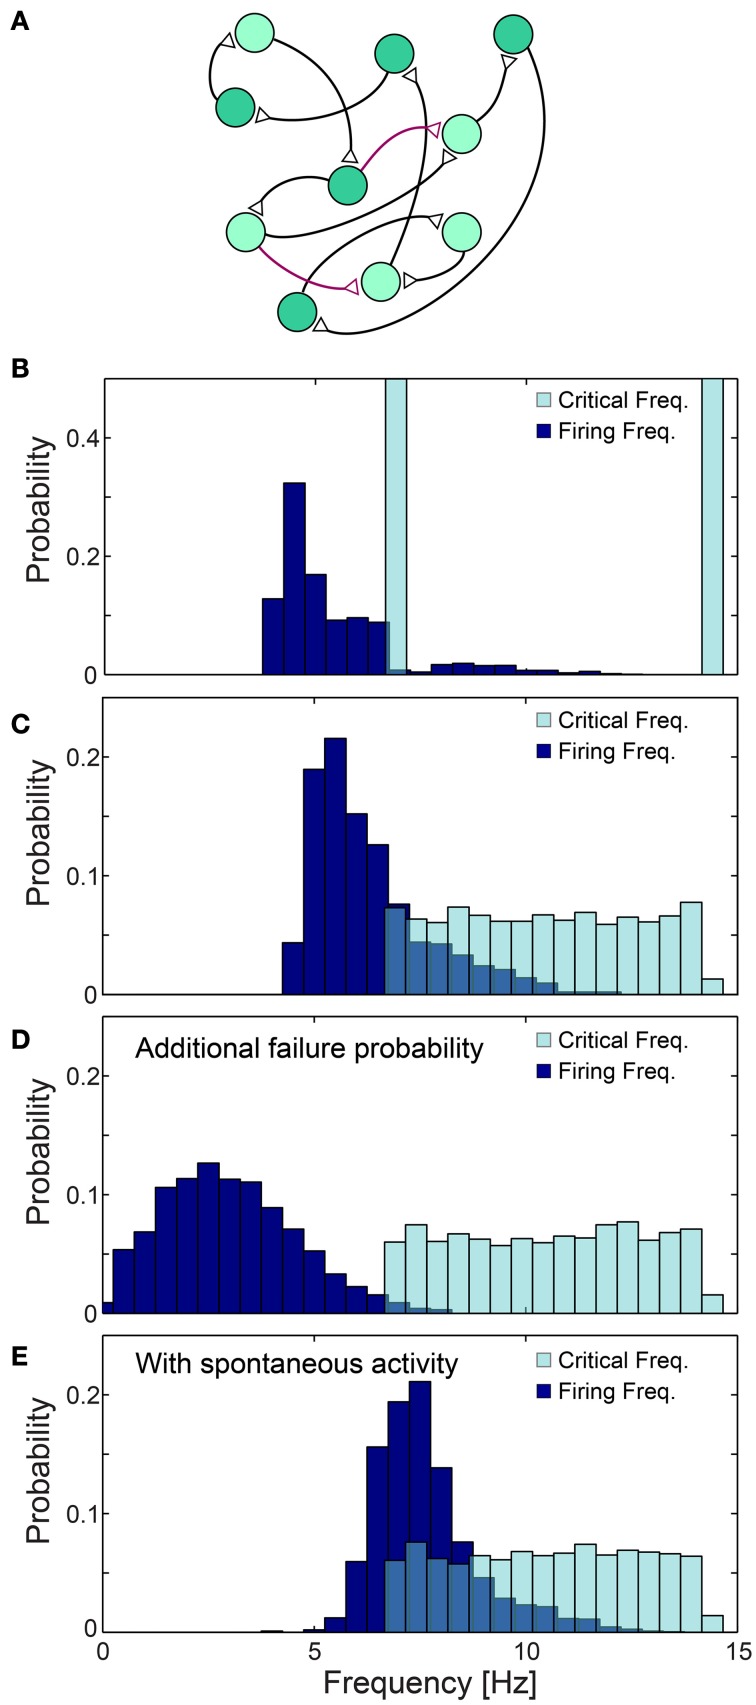
Figure 11.
Neuronal cooperation on a network level leading to low firing rates. (A) Schematic of the connectivity of the simulated neural network. First, each neuron has one randomly chosen above-threshold post-synaptic and pre-synaptic connection (black), where supplemental connections are drawn with probability 0.1/N (purple), where N stands for the network size. Delays are selected randomly from U(6, 9.5) ms and each neuronal fC is selected randomly from two values (light/dark green). (B–E) Normalized histograms of critical frequencies, fC (light blue), and firing frequencies (dark blue) obtained in simulations for the network topology (A) with N = 2000. (B) fC is either 14.28 or 6.66 Hz. (C) fC is taken randomly from U(6.66, 14.28) Hz. (D) Pfail = 0.07 is added for all firing frequencies, even below fC. (E) Spontaneous stimulations are added with an average rate of 1 Hz per neuron. All histograms were estimated several seconds after the initialization of the network (see Materials and Methods), using a time window of about 50 s. The observed distribution, (B–E), of the firing rates were found to be independent of the initial external stimulation patterns given to the network, indicating neuronal cooperation that reduces firing frequencies toward the lowest critical frequencies, fC. All the results shown in this figure were produced in simulations.

