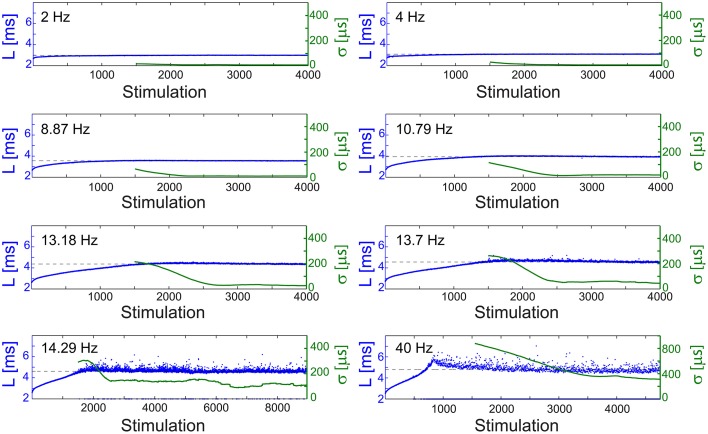
Figure 4.
Stabilization at different latencies. The NRL, L, of a cultured neuron under periodic stimulations at 2 Hz (500 ms), 4 Hz (250 ms), 8.87 Hz (112.74 ms), 10.79 Hz (92.68 ms), 13.18 Hz (75.87 ms), 13.7 Hz (72.99 ms), 14.29 Hz (69.98 ms), and 40 Hz (25 ms) (blue). The stabilization latencies are marked by the dashed-lines (average L over the last 500 responses). Response failures are denoted at L = 2 ms. The standard deviation, σ, is shown smoothed using 1000 responses sliding window (green).

