Figure 7.
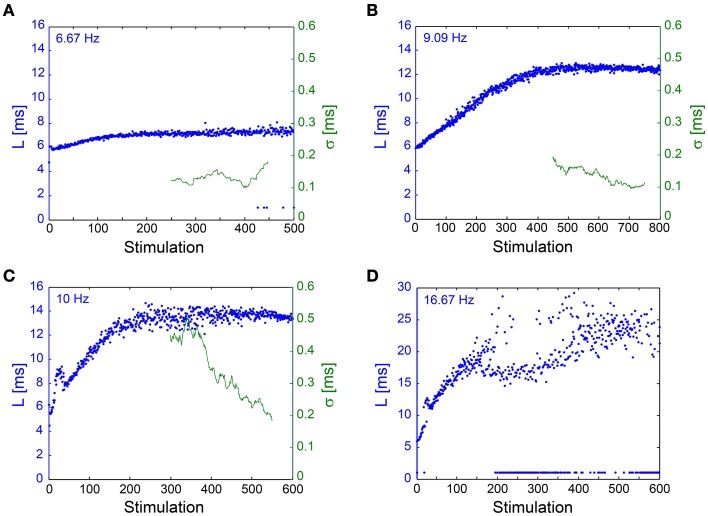
NRL stabilization measured using an In Vivo experimental setup. Examples of the NRL, L, (blue) of a neuron recorded intracellularly in vivo, where stimulations were given extracellularly, ~1.5 mm away, [see Materials and Methods, in vivo experiments section, similar to previous publications (Stern et al., 1997, 2004; Brama et al., 2014)], at various stimulation frequencies. Response failures are denoted at L~1 ms. The standard deviation (σ, green), smoothed using a 50 Stimulation window, is shown for (A–C). (A) Stimulations at 6.67 Hz. The NRL stabilizes at LC ~7.2 ms, while σ is relatively constant around 0.1 ms. (B) Stimulations at 9.09 Hz. The NRL stabilizes at LC ~12.5 ms, while σ is stabilized around 0.1 ms. (C) Stimulations at 10 Hz. The NRL stabilizes at LC ~13.6 ms, while σ decreases toward and even below 0.2 ms. (D) Stimulations at 16.67 Hz. The NRL at the intermittent phase fluctuates around LC = 23 ms, indicating ~17 ms NRL stretching. A relatively large amount of response failures emerge, such that fC ~15 Hz.

