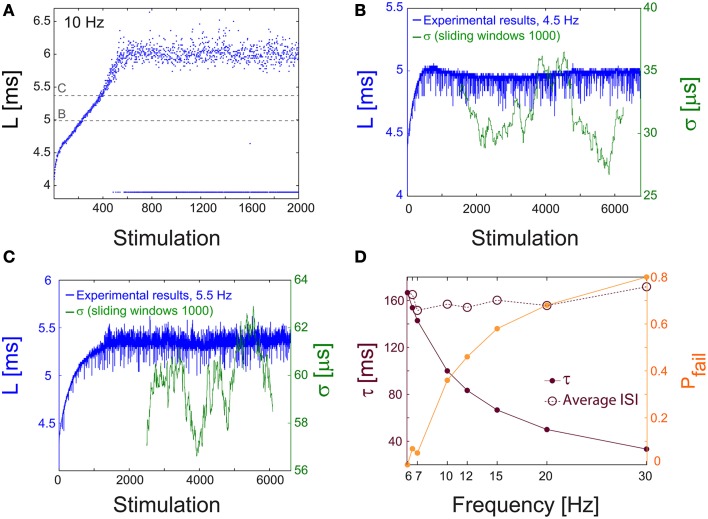
Figure 9.
NRL measured in unblocked cultures of cortical neurons. (A) The NRL, L, of a neuron embedded within a large-scale network of cortical cells in vitro (but not functionally separated from the network by synaptic blockers, see Materials and Methods), stimulated at 10 Hz. At the intermittent phase response failures occur (denoted as dots at L~4 ms), and the NRL stabilizes at LC ~6.4 ms. The latencies discussed in the following panels, in (B) at L~5 ms, and in (C) at L~5.45 ms, are shown as guidelines (dashed gray lines). (B) The NRL, L, for a stimulation frequency of 4.5 Hz (blue). The average NRL over the last 2000 responses is ~4.9 ms. The standard deviation, σ, is shown smoothed using 1000 Stimulation sliding window (green). (C) Same as (B) but for a stimulation frequency of 5.5 Hz, resulting in an average NRL of L~5.4 ms measured over the last 2000 latencies. (D) The experimentally measured probability for response failures, Pfail (orange dots) and the corresponding τ (crimson dots) at different frequencies in the range of [6, 30] Hz. For each frequency the averaged ISI = τ/(1-Pfail) (crimson circles) is very close to τC = 160 ms (fC ~6.2 Hz), independent of the stimulation frequency.

