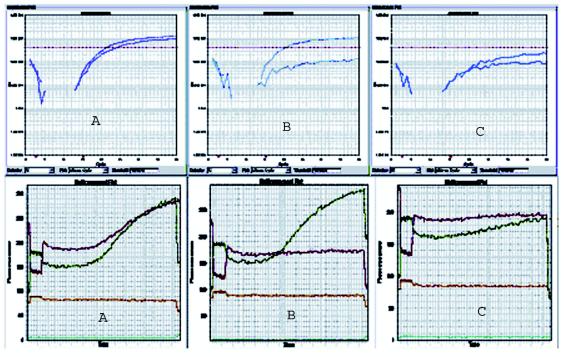
FIG. 1.
QRDR amplification curves and multicomponent data plots from the ABI 7900HT sequence detection system. A, B, and C refer to sample types for which sequence data are given in Table 1. Each plot represents diplex results for one sample. Upper set of curves show relative fluorescence versus PCR cycle number. The lower set of curves depict the relative fluorescence of each fluorophore as compared to that of the background over time.

