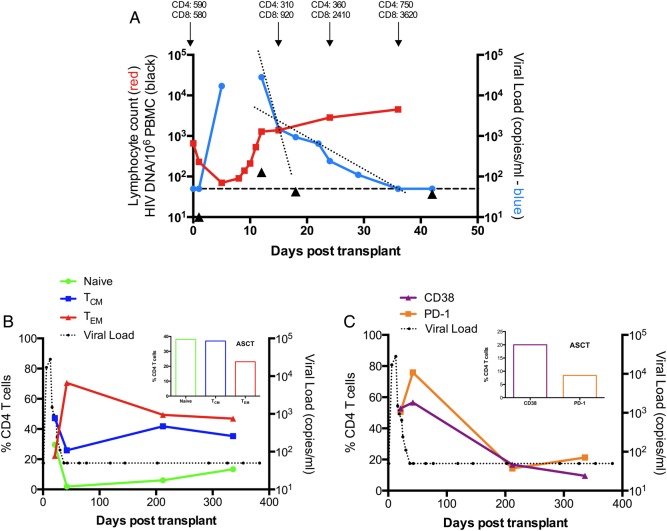
Figure 1.
Dynamic changes in human immunodeficiency virus (HIV) viremia and CD4 T-cell activation levels following transplantation of CD34-enriched peripheral blood stem cells (day 0). A, Plasma HIV-1 RNA (copies/mL; blue circles), total lymphocyte count (×103/mm3; red squares), and total viral DNA (HIV-1 copies/million peripheral blood mononuclear cells [PBMCs]; black triangles) over time following reinfusion of stem cells demonstrating first and second phase decay (dotted lines). Dashed line represents the lower limit of detection of the HIV-1 RNA viral load assay (50 copies/mL plasma). Note: The first HIV DNA measurement was below the limit of detection and has been plotted at 10 copies due to limitations of a logarithmic scale. Cytotoxic chemotherapy was administered at day 1. B, Frequency of CD4 naive and memory subsets over time: Tcm = central (CD45RO+CD27+) memory, Tem = effector (CD45RO+CD27−) memory (C). The frequency of CD38 (purple) and PD1 (orange) on CD4 T lymphocytes following stem cell infusion relative to plasma virus loads (black spheres). Inserts in (B) and (C) show cell subset frequencies in the pretreatment leukapheresis sample (autologous stem cell transplant [ASCT]).

