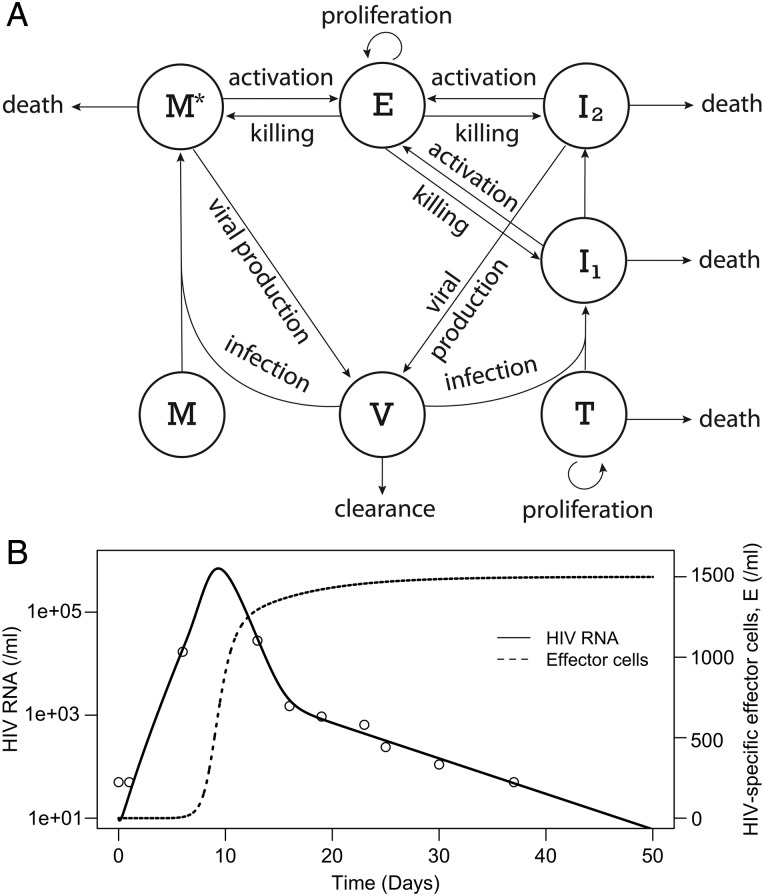
Figure 2.
Mathematical modeling is consistent with CD8+ T-cell–mediated killing of infected cells. A, Schematic illustration of mathematical model. On the left, cells M, which might be macrophages or resting CD4+ T cells, when infected by human immunodeficiency virus type 1 (HIV-1), V, become long-lived infected cells, M*, which are estimated to be responsible for a few percent of body-wide viral production [25]. The cells on the right, T, are the major targets of HIV infection. After infection, the cells, I1, are in an eclipse phase and do not produce virus until they transition into productively infected cells, I2. Both I2 and M cells produce virus, V. This free virus can, in turn, infect uninfected target cells, T and M. When effector cells, E, contact infected cells they become activated, resulting in both killing of the infected target and proliferation of the effector cell. The model also considers the death rates of cells and the viral clearance rate. B, Results of simulating the model given by Eq. (1) detailed in the Supplementary text; HIV-1 RNA/mL (solid) and effector cells/ mL (dotted). Parameters used are as follows: r = 0.8 d−1, β = 1.66 × 10⁻⁸ mL d−1, βM = 4.14 × 10⁻⁹ mL d−1, dT = 0.5 d−1, Tmax = 106/mL, t1 = 6 d, M = 6 × 10⁴/mL, δ = 0.9 d−1, δE1 = 0.01 mL d−1, δE2 = 0.001 mL d−1, δEM* = 10−4 mL d−1, δM = 0.01 d−1, k = 1.0 d−1, q = 0.2 d−1, K = 1, p = 20 000 d−1, pM = 200 d−1, and c = 23 d−1. The initial conditions were T(0) = 6 × 10⁵ /mL, I1(0) = I2(0) = M*(0) = 0, E(0) = 0.05/mL, and V(0) = 10/mL. The viral loads generated by the model agree with the ones measured in the patient (open circles). The magnitude of the effector cell response is also consistent in magnitude to the measured level of HIV-1–specific CD8 T-cell responses at day 42 shown in Figure 3.

