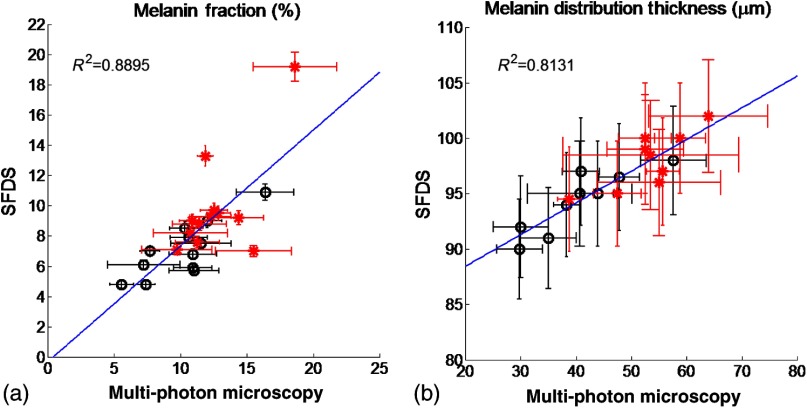
Fig. 8.
Correlation of mean (a) melanin concentration () and (b) melanin distribution thickness () between MPM and SFDS. Here the mean, site-specific [i.e., volar upper arm (black-circle) and dorsal forearm (red-asterisk)] results from each subject are plotted between each modality, independent of any skin type assessment. The error bars represent the variance within the measurement volume along the MPM axis and the estimated model error along the SFDS axis.

