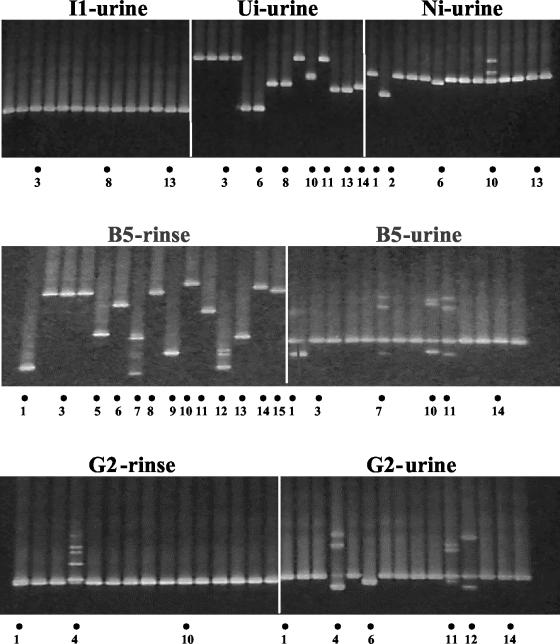
FIG. 1.
Composite of three DGGE gel photographs. Each panel represents one gel. Each gel accommodated, for a given study individual, K1/V1 amplified from up to 15 K1/V1 clones generated per sample. PCR products that underwent sequencing are indicated by dots at bottom; numerals indicate the lane in the gel.

