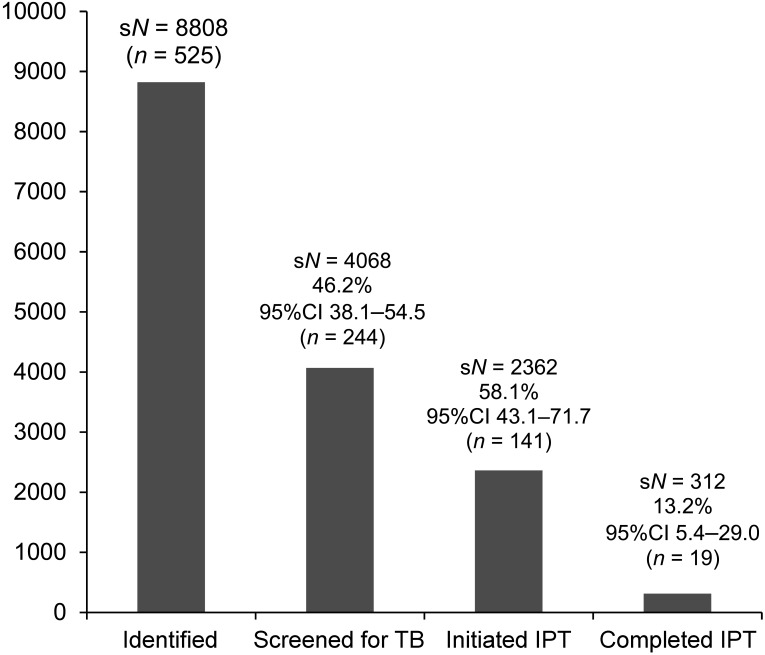
FIGURE 2.
Histogram demonstrating the sample weighted records of child contacts aged <5 years identified, screened for TB, initiated on IPT and who completed 6 months of IPT. sN = weighted sample population; % = weighted sample proportion; CI = confidence interval adjusted due to complex sample analysis; n = actual records; TB = tuberculosis; IPT = isoniazid preventive therapy.

