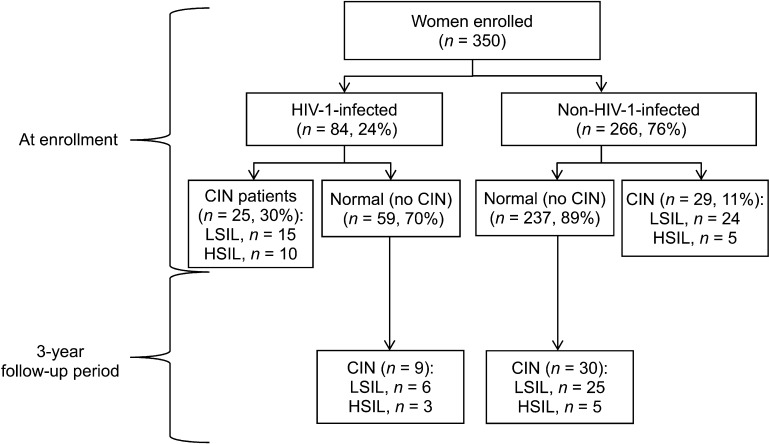
FIGURE.
Flow chart showing the prevalence and incidence of CIN among HIV-1-infected and non-infected sex workers in Nairobi, Kenya, 2009–2012. HIV = human immunodeficiency virus; CIN = cervical intra-epithelial neoplasia; LSIL = low-grade squamous intra-epithelial lesion; HSIL = high-grade squamous intra-epithelial lesion.

