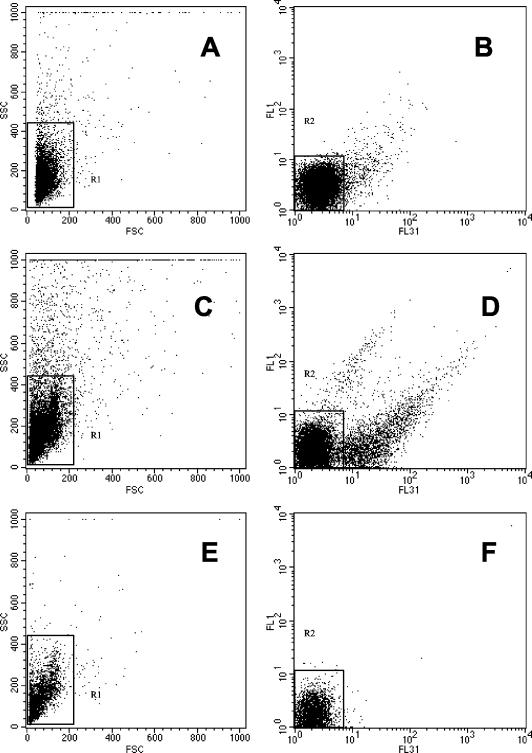
FIG. 2.
FSC-versus-SSC and FL1 (515 to 545 nm)-versus-FL31 (633 to 677 nm [FL3 in laser 1]) fluorescence dot plots on unsorted material from cesium chloride density gradients performed on samples from two patients (patient A [A and B, respectively]; and patient B [C and D, respectively]). (E and F) FSC-versus-SSC and F2-versus-F31 dot plots, respectively, on sorted material from patient B. Boxed areas region 1 (R1) and region 2 (R2) enclose concentrations of E. bieneusi spores. Of the sorted events, 98% were contained in R1 of the FSC-versus-SSC dot plot (E) and 99% were contained in R2 of the FL1-versus-FL31 dot plot (Fig. 2F).

