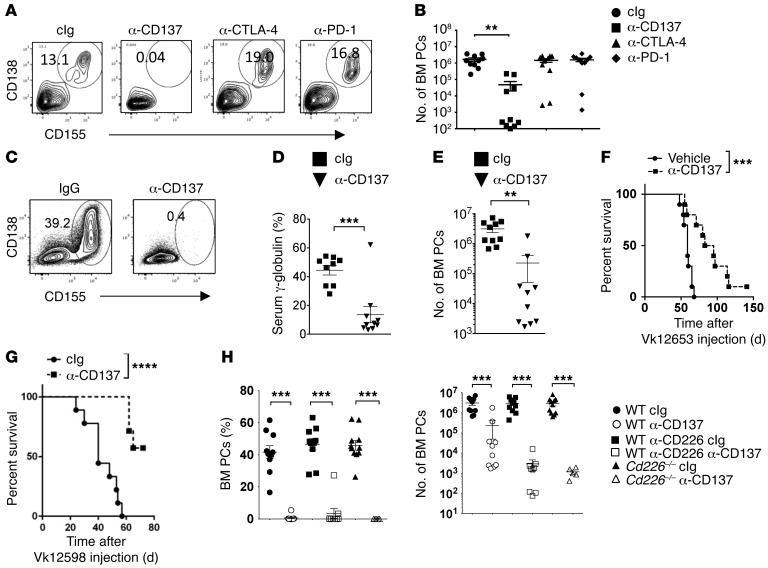
Figure 6. Therapeutic efficacy of anti-CD137 immunotherapy against myeloma.
(A and B) WT mice were injected with cIg, anti-CD137, anti–PD-1, or anti–CTLA-4 and subsequently challenged with 2 × 10⁶ Vk12653 MM cells. Representative FACS plot showing the percentages (A) and graphs showing the numbers (B) of CD138+CD155+ PCs in the BM at the end of the treatment. Data are representative of 2 independent experiments involving groups of n = 10 mice. (C–F) WT mice were injected i.v. with 2 × 10⁶ Vk12653 MM cells. After 3 weeks, mice were injected either with IgG or anti-CD137 mAbs. Representative FACS plot and graph showing the percentages (C), the mean γ-globulin percentages (D), the mean numbers ± SEM of malignant CD138+CD155+ PCs in the BM (E) and the survival (F) of the indicated groups of mice. Each symbol represents 1 individual mouse. (G) WT mice were injected i.v. with 4 × 10⁵ Vk12598 MM cells. After 1 week, mice were treated with IgG or anti-CD137 mAb twice a week for 4 weeks, and their survival was monitored. Experiment involving groups of n = 10 mice. (H) WT and Cd226–/– mice were injected i.v. with 2 × 10⁶ Vk12653 MM cells. After 3 weeks, mice were injected either with IgG or anti-CD226 mAb and were subsequently treated with cIg or anti-CD137. Graphs show the percentages and the mean numbers ± SEM of malignant CD138+CD155+ PCs in the BM at the end of the treatment. Data are pooled from 2 independent experiments. **P < 0.01, ***P < 0.001, ****P < 0.0001; Mann-Whitney U test (B, D, E, and H) and Mantel-Cox test (F and G).

