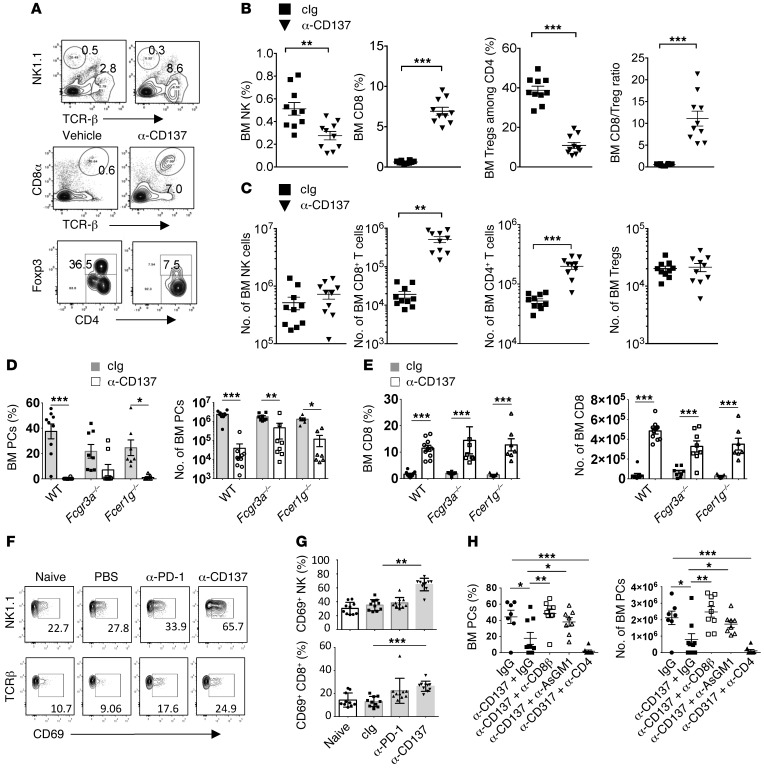
Figure 7. Mechanism of anti-CD137 immunotherapy against myeloma.
(A–H) The indicated groups of mice were injected i.v. with 2 × 10⁶ Vk12653 MM cells. After 2–3 weeks, mice with established MM were injected either with IgG, anti-CD137, or anti–PD-1 mAbs. (A–C) Representative FACS plot (A) and graphs showing the percentages (B) and the number (C) of the indicated populations of immune cells after 3 weeks of treatment with cIg or anti-CD137. Data are pooled from 2 independent experiments. (D and E) Graphs showing the percentages and the number of malignant PCs (D) or CD8+ T cells (E) in the BM of WT, Fcgr3a–/–, or Fcer1g–/– mice treated with IgG or anti-CD137 mAb. (F and G) Representative FACS plot (F) and graphs showing the percentages (G) of NK cells or CD8+ T cells expressing CD69 activation marker 6 days after the beginning of the indicated treatment. Data are pooled from 2 independent experiments. (H) Mice were injected with control IgG, anti-CD8β, anti-AsGM1, or anti-CD4 to deplete CD8+, NK, or CD4+ cells before anti-CD137 therapy. The percentages and the number of CD138+B220– PCs were analyzed by flow cytometry in the BM of the indicated groups of mice at the end of the treatment. Representative experiment out of 2 involving groups of n = 10 mice. *P < 0.05, **P < 0.01, ***P < 0.001; Mann-Whitney U test.

