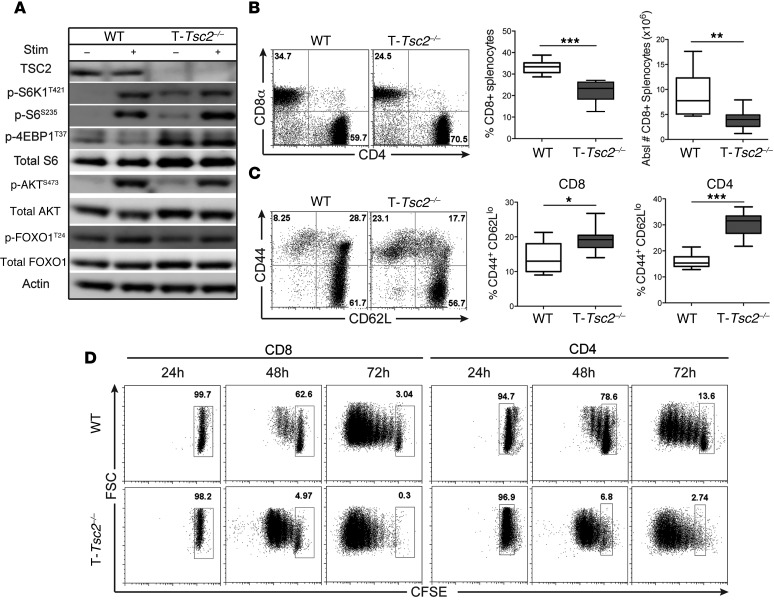
Figure 1. Tsc2 deletion in CD8+ T cells yields a hyperactivated phenotype.
WT and T-Tsc2–/– splenocytes were harvested from 6-week-old mice. (A) mTORC1 and mTORC2 activity was assessed by immunoblot analysis from isolated CD8+ T cells left unstimulated or after 3-hour αCD3/αCD28 stimulation. (B) Flow cytometric analysis of CD4 and CD8 expression gated from CD3+ cells and the mean percentage and absolute number of CD8+ T cells (n = 9). (C) Flow cytometric analysis of CD44 and CD62L expression gated from the CD8+ population, with statistics shown to the right for both CD8+ and CD4+ T cells (n = 9). (D) CFSE-labeled splenocytes from WT and T-Tsc2–/– mice were stimulated with αCD3. CFSE dilution of CD8+ and CD4+ T cell populations was determined following 24, 48, and 72 hours of stimulation. Data are representative of at least 3 independent experiments. For the box-and-whiskers plots, the whiskers represent the minimum and maximum values, the box boundaries represent the 25th and 75th percentiles, and the middle line is the median value. *P < 0.05, **P < 0.01, ***P < 0.001, Mann-Whitney t tests.

