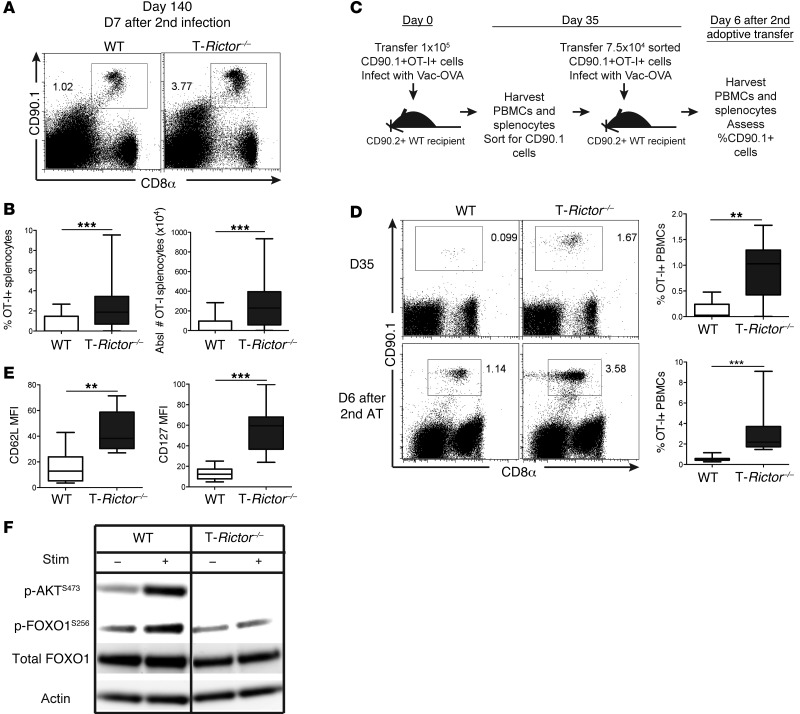
Figure 10. mTORC2 inhibition promotes memory generation.
(A–E) 1.5 × 10⁵ naive sorted OT-I+ T cells were transferred into WT CD90.2+ recipients infected with vaccinia-OVA. (A and B) Mice were given secondary infection of lm-OVA 133 days after initial infection, and 7 days later, the percentage and absolute number of recovered OT-I+ splenocytes was determined (n = 20). (C) Experimental schematic for D. (D) Flow cytometric analysis of the percentage of OT-I+ cells recovered from blood 35 days after primary infection, with statistics shown on the right (n = 9) (top). OT-I+ cells were purified after harvest on day 35, transferred into new recipients infected with vaccinia-OVA, and 6 days later, percentage of OT-I+ PBMCs was determined (labeled as “D6 after 2nd AT”), with statistics shown to the right (n = 7) (bottom). (E) CD62L and CD127 expression of recovered OT-I+ splenocytes 35 days after primary infection (n = 9). (F) p-FOXO1 protein expression was detected from in vitro–stimulated and IL-7– and IL-15–expanded CD8+ T cells with or without restimulation. Data are representative of at least 3 independent experiments. For the box-and-whiskers plots, the whiskers represent the minimum and maximum values, the box boundaries represent the 25th and 75th percentiles, and the middle line is the median value. **P < 0.01, ***P < 0.001, Mann-Whitney t tests.

