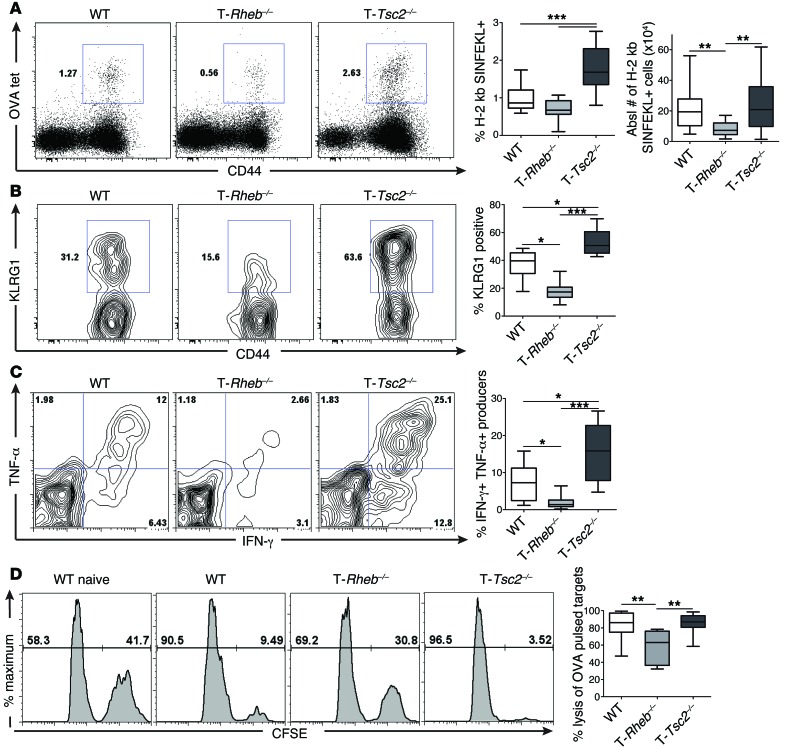
Figure 3. mTORC1 activity is required for effector generation in vivo.
WT, T-Rheb–/–, and T-Tsc2–/– mice were infected with 1 × 10⁶ PFU vaccinia-OVA. On day 6, splenocytes were harvested. (A) Percentage of antigen-specific CD8+ T cells from day 6 infected mice was determined by flow cytometric analysis of H-2 kb/SIINFEKL tetramer staining (OVA tet). Plots were gated from the CD8+ population. Graphs depict the percentage of tetramer+ cells from the CD8+ population and the absolute number of tetramer+ cells (n = 16). (B) KLRG1 expression was assessed from the tetramer+ population, with statistics shown to the right (n = 16). (C) Cytokine production was assessed from the CD44+CD8+ splenic populations after ex vivo stimulation with SIINFEKL peptide. The graph depicts the percentage of double-producing cells (n = 16). (D) Functional analysis of CD8+ T cells by an in vivo CTL assay 6 days after vaccinia-OVA infection. Plots depict CFSEhi SIINFEKL peptide–pulsed targets and CFSElo control targets recovered from splenocytes harvested 10 hours after target transfer, with statistics shown to the right (n = 18). Data are representative of at least 3 independent experiments. For the box-and-whiskers plots, the whiskers represent the minimum and maximum values, the box boundaries represent the 25th and 75th percentiles, and the middle line is the median value. *P < 0.05, **P < 0.01, ***P < 0.001, ANOVA.

