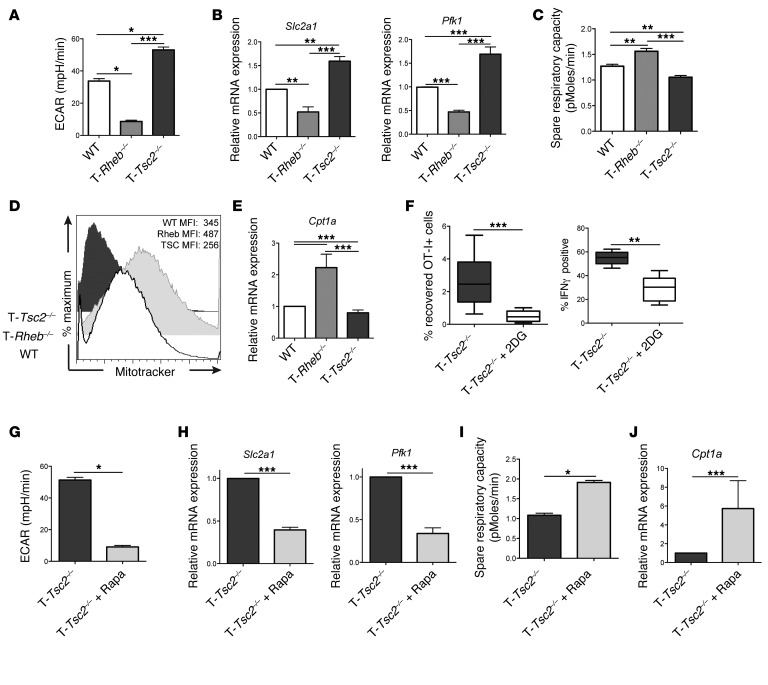
Figure 7. mTORC1 activity influences CD8+ T cell metabolism upon TCR stimulation.
(A–E) Purified CD8+ T cells from WT, T-Rheb–/–, and T-Tsc2–/– mice were stimulated in vitro for 48 hours and cultured in IL-7 and IL-15 for 3 days. (A) Cells were run on an extracellular flux analyzer, and ECAR was determined. Data are mean ± SEM of 7 measurements. (B) RNA was extracted and relative expression of GLUT1 (Slc2a1) and Pfk1 transcripts was determined by qPCR. (C) As in A, SRC was determined. (D) MitoTracker Green staining was assessed by flow cytometry. (E) As in B, Cpt1a expression was measured. (F) T-Tsc2–/– OT-I+ T cells were transferred into congenically distinct recipients infected with vaccinia-OVA. A cohort of mice received 2DG daily. On day 6, splenocytes were harvested and the percentage of OT-I+ cells (n = 9) and percentage of IFN-γ–positive OT-I+ cells was determined after SIINFEKL stimulation (n = 5). For the box-and-whiskers plots, the whiskers represent the minimum and maximum values, the box boundaries represent the 25th and 75th percentiles, and the middle line is the median value. (G–J) Purified T-Tsc2–/–CD8+ T cells were stimulated in vitro for 48 hours with or without 0.5 μM rapamycin. Cells were expanded in media supplemented with IL-7 and IL-15 with or without 0.5 μM rapamycin for 3 days. (G) As in A, ECAR was measured. Data are mean ± SEM of 4 measurements. (H) As in B, relative expression of Slc2a1 and Pfk1 transcript was detected. (I) As in G, SRC was determined, and (J) relative expression of Cpt1a transcript was measured. Statistics for A–E were determined by ANOVA and those for F–J were measured by Mann-Whitney t tests. Data are representative of 3 independent experiments. *P < 0.05, **P < 0.01, ***P < 0.001

